
Fad***com03/07/2021 21:20
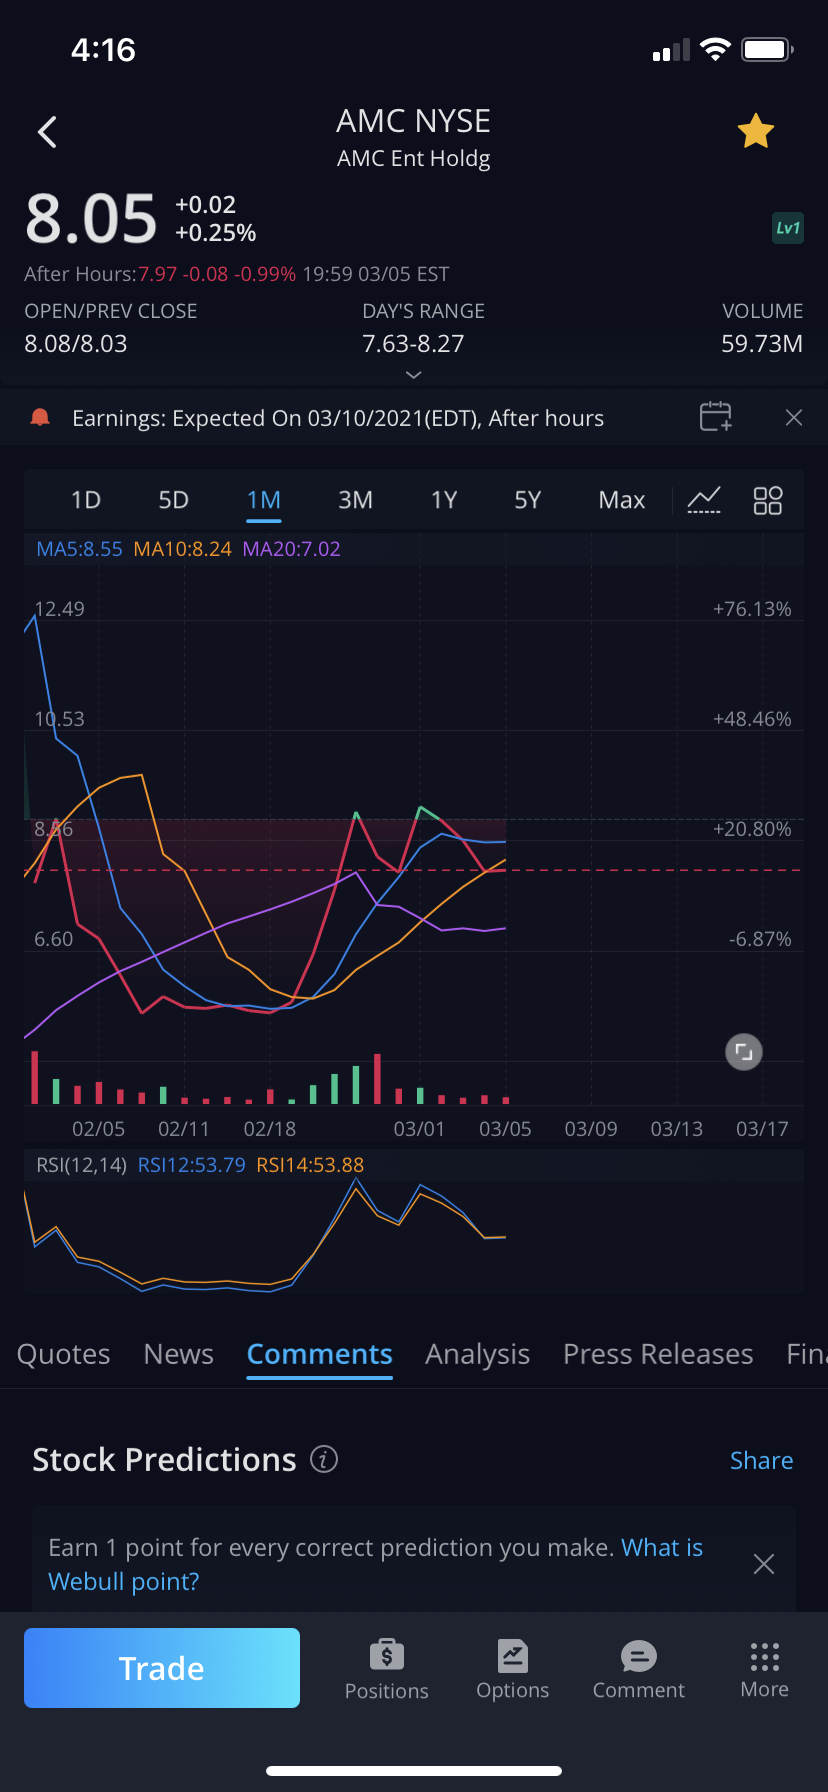
$Amc Entmt Hldgs Inc Can Someone that knows chart analysis explain to me how is the stock will be going up. Even though it’s overvalued at the moment and the MA5 and MA10 are about to touch. Which would indicate that graph graph is going to crash down to the purple line? Also the RSI is above 30 its at like 50 something. Help me understand please
11
4
Disclaimer: The comments, opinions or any other information provided herein are from the users who are posting onto the Webull platform and not from Webull. The content provided by such users do not represent the opinion of Webull, and should not be construed as investment advice or recommendation, nor as an offer or solicitation to deal in any investment product. Investors should consider their investment objectives and risks carefully before investing. If in doubt, please seek advice from professional financial advisers. For more information, please refer to the Webull Community Agreement.

Share your ideas here…
All Comments
No data yet, let's see others
Fad***com
0
Following
2
Post
0
Wefolios
No content on the Webull website shall be considered a recommendation or solicitation for the purchase or sale of securities, options or other investment products. All information and data on the website is for reference only and no historical data shall be considered as the basis for judging future trends.
Copyright © 2026 Webull. All Rights Reserved
No content on the Webull website shall be considered a recommendation or solicitation for the purchase or sale of securities, options or other investment products. All information and data on the website is for reference only and no historical data shall be considered as the basis for judging future trends.
- Copyright © 2026 Webull. All Rights Reserved