
ButWhoAmI11/14/2020 02:13
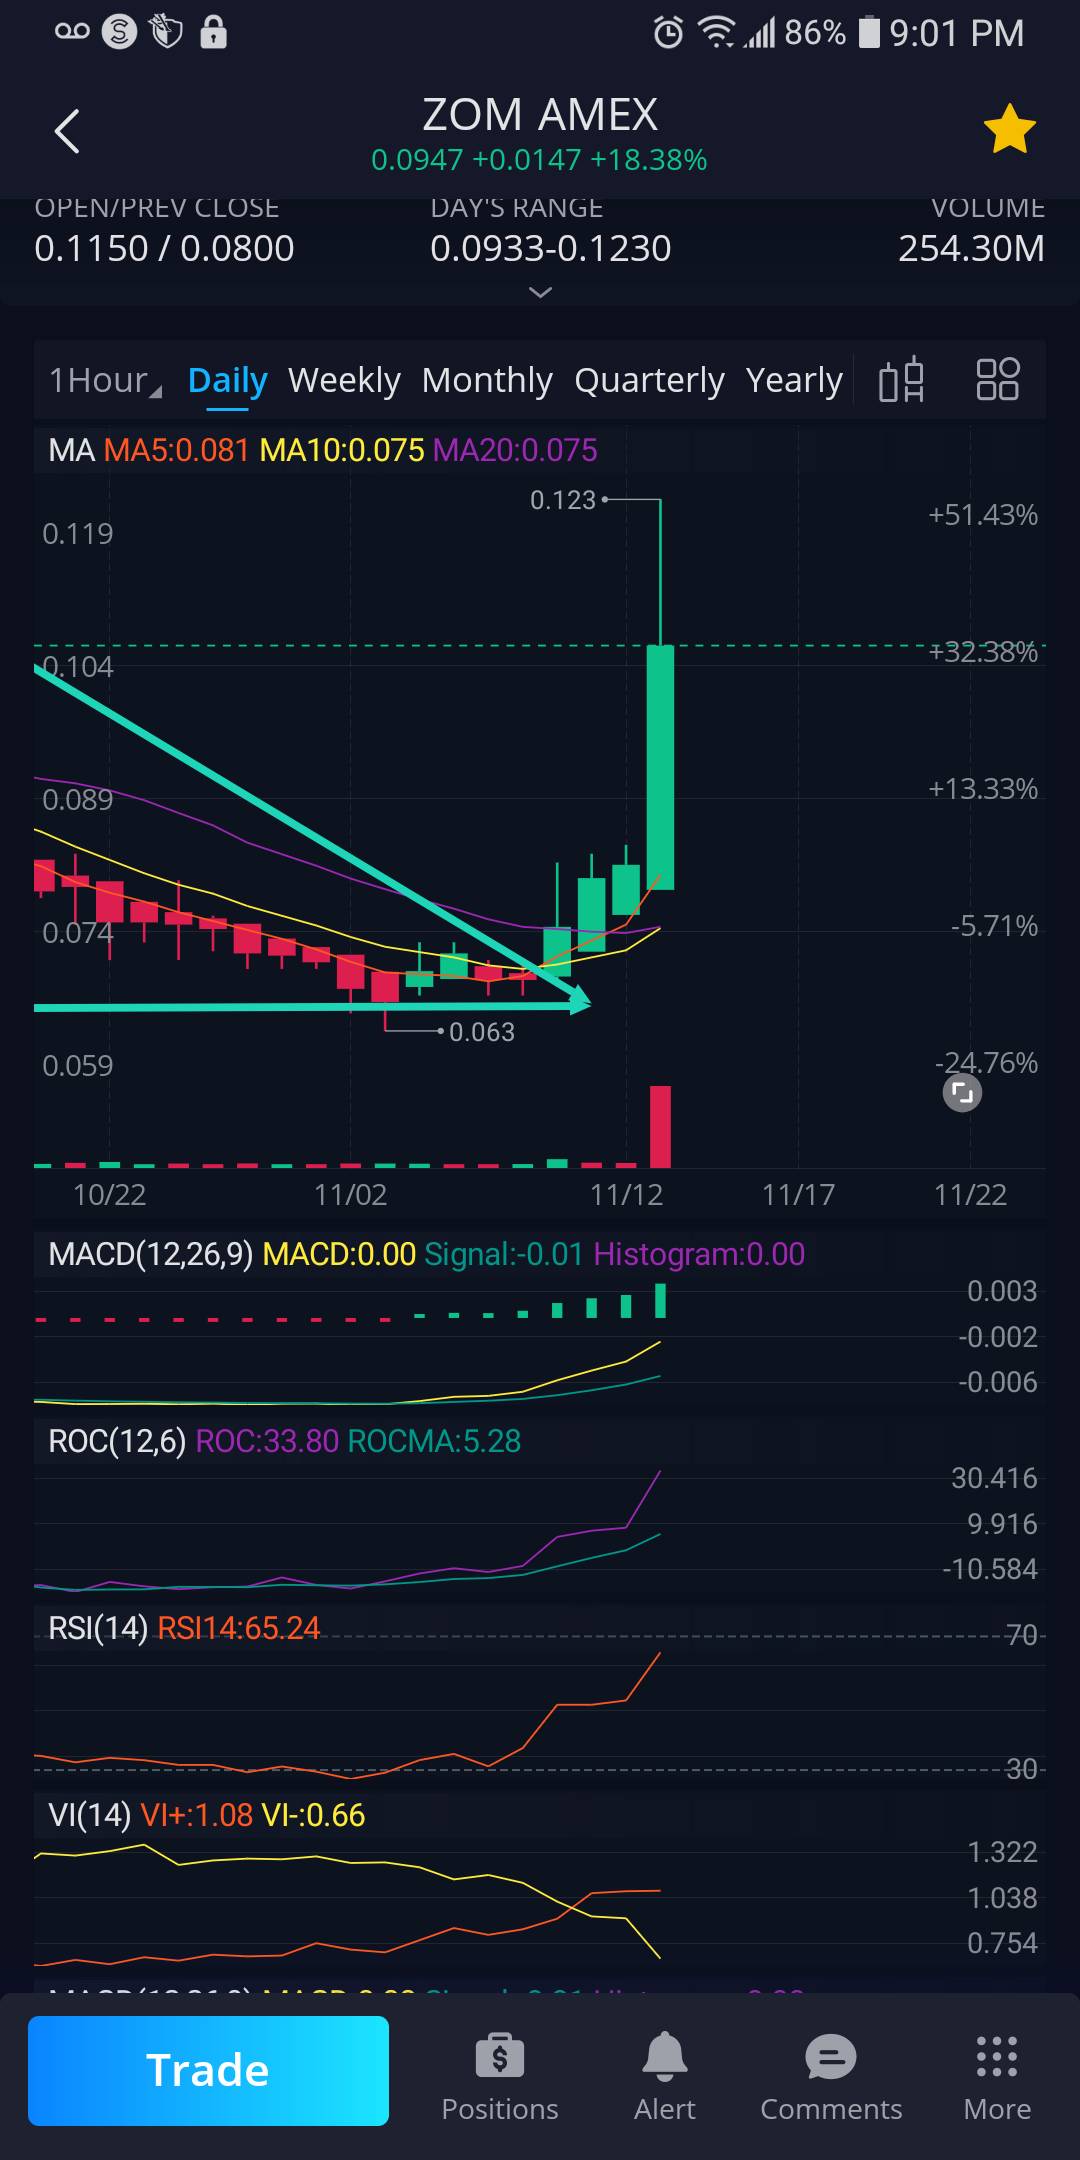
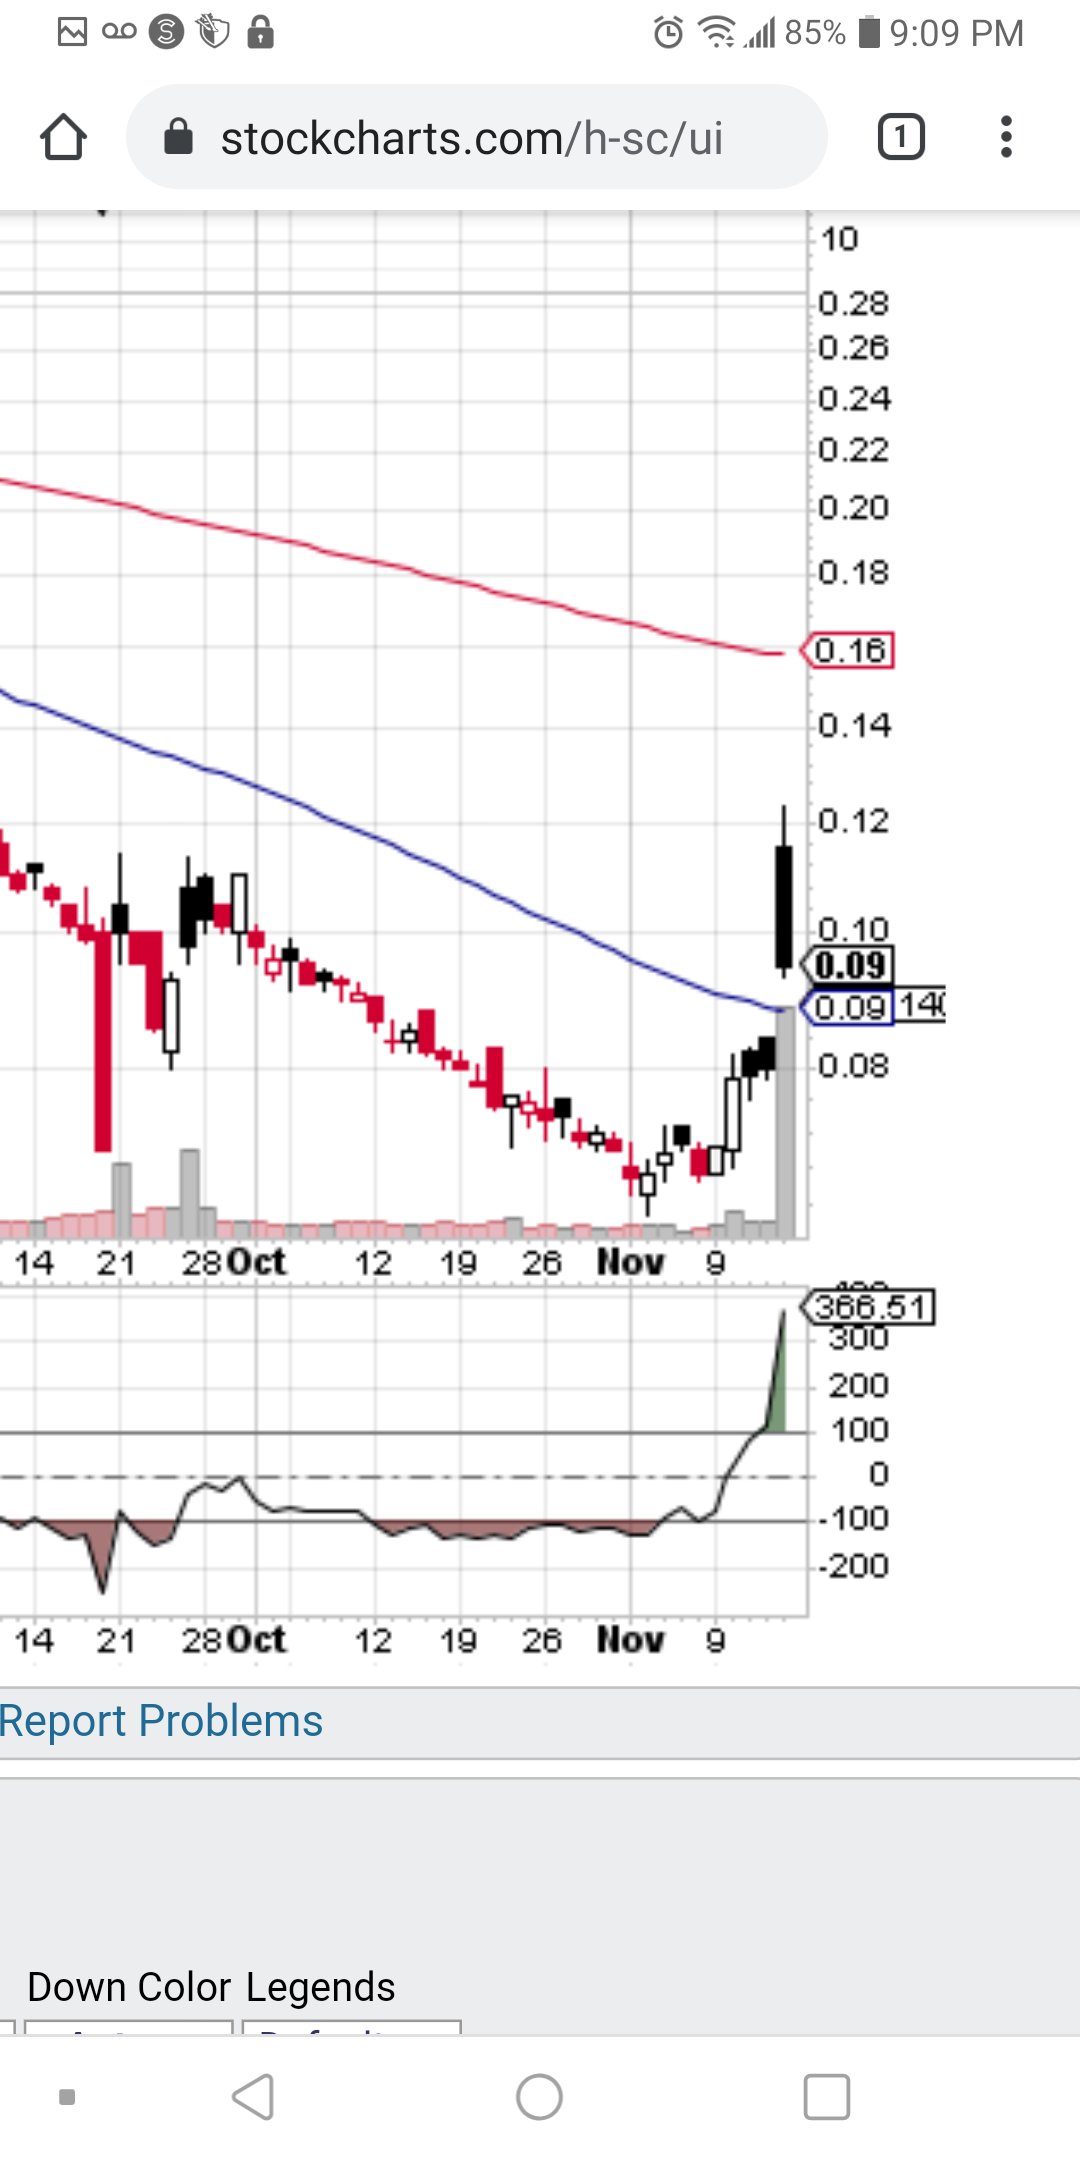
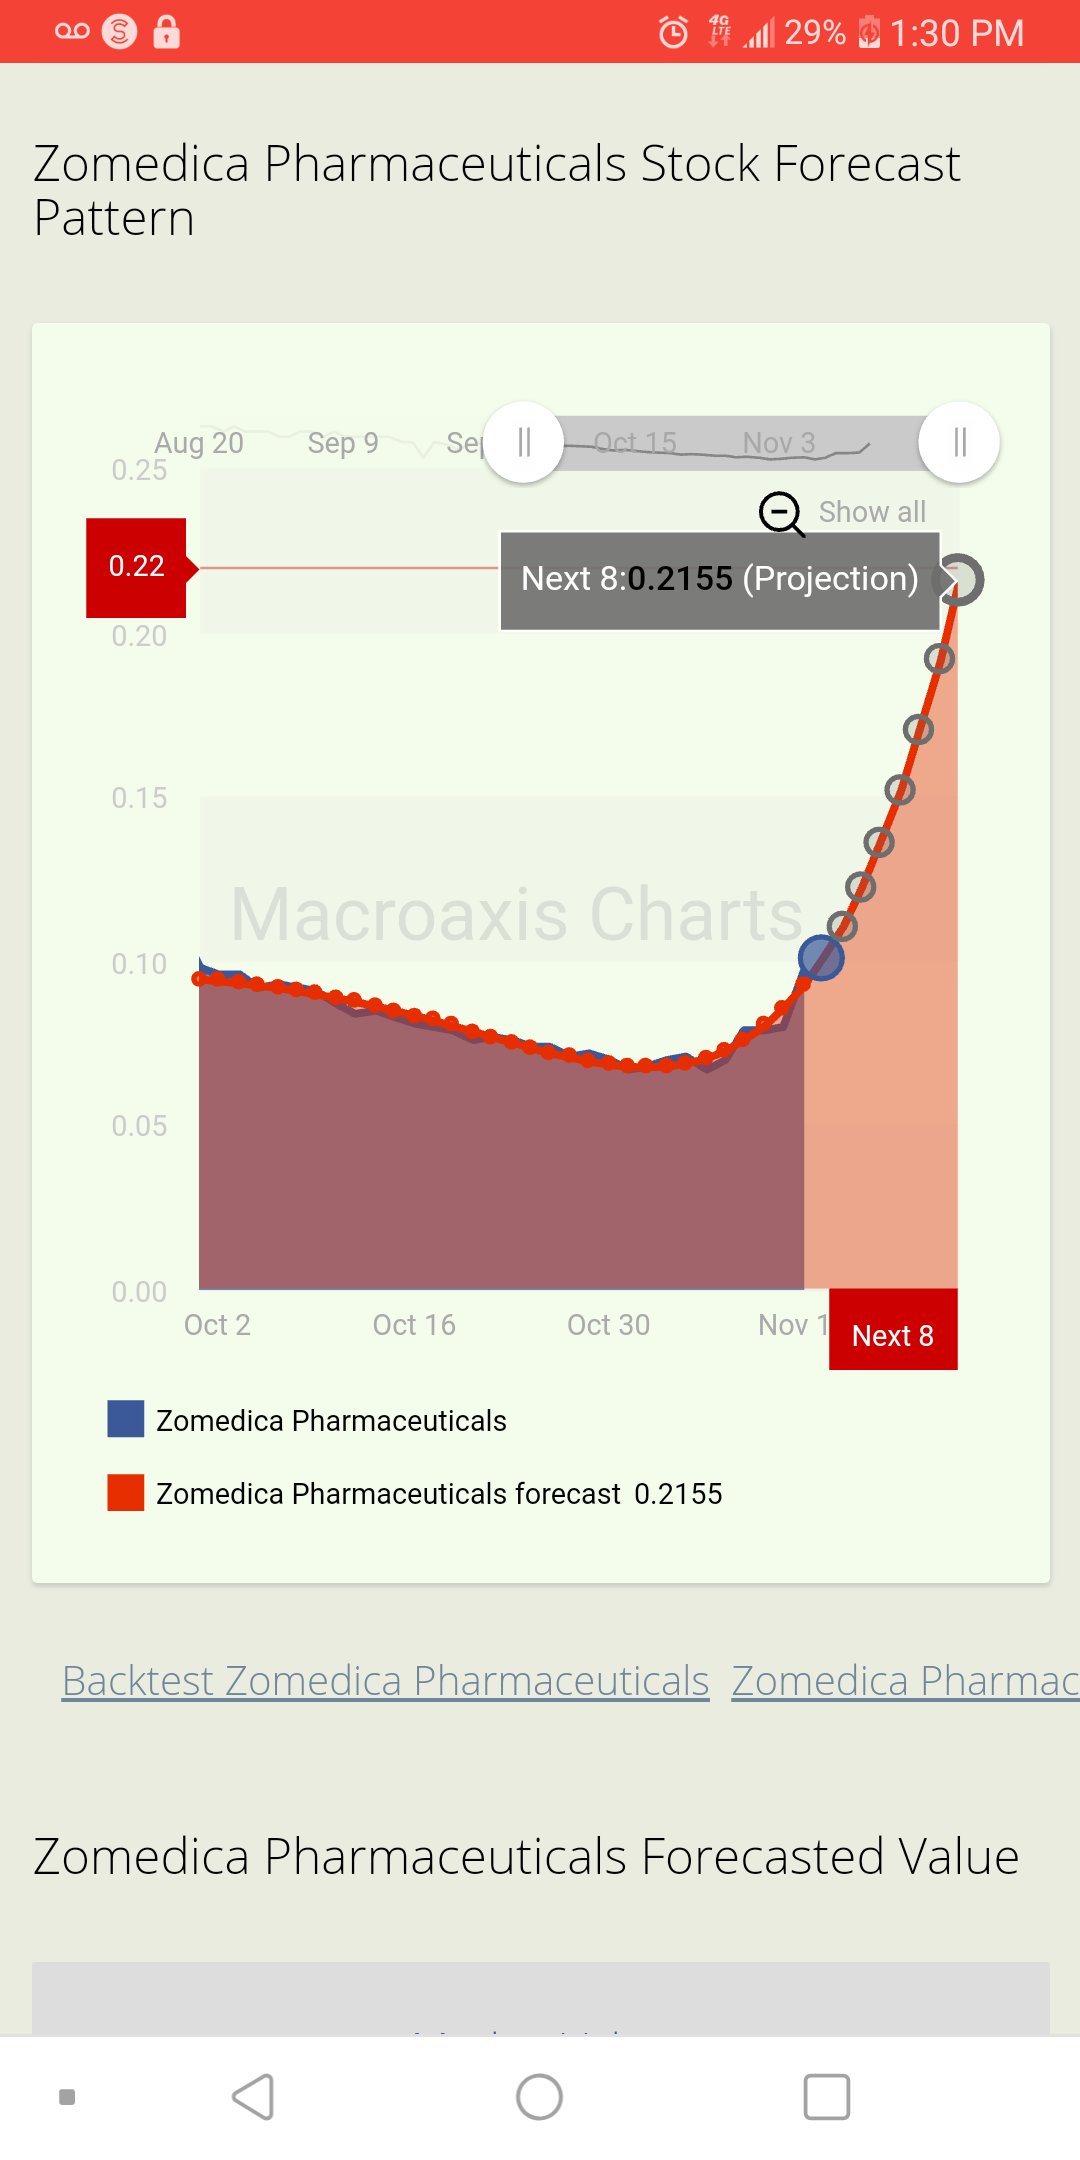
$Zomedica Corp Daily Chart: Break Above Descending Triangle. For the first time since June, we are Above resistance. Notice the vortex indicator + (Orange) is above the - (Yellow). I see a slow but continual rise. Today we tested 50 day move average, next up 200 day (.16) and then above (Golden Cross) (Compliance) ???↗
6
11
Disclaimer: The comments, opinions or any other information provided herein are from the users who are posting onto the Webull platform and not from Webull. The content provided by such users do not represent the opinion of Webull, and should not be construed as investment advice or recommendation, nor as an offer or solicitation to deal in any investment product. Investors should consider their investment objectives and risks carefully before investing. If in doubt, please seek advice from professional financial advisers. For more information, please refer to the Webull Community Agreement.

Share your ideas here…
All Comments
No data yet, let's see others
ButWhoAmI
42
Following
2763
Post
0
Wefolios
No content on the Webull website shall be considered a recommendation or solicitation for the purchase or sale of securities, options or other investment products. All information and data on the website is for reference only and no historical data shall be considered as the basis for judging future trends.
Copyright © 2026 Webull. All Rights Reserved
No content on the Webull website shall be considered a recommendation or solicitation for the purchase or sale of securities, options or other investment products. All information and data on the website is for reference only and no historical data shall be considered as the basis for judging future trends.
- Copyright © 2026 Webull. All Rights Reserved