MACD-What does It Imply?

The MACD chart gives out signals, which combined with price actions can help investors to determine the momentum of a trend or potential entry or exit points.
The MACD line oscillates around zero, which serves as the baseline. The MACD is positive when the 12-d moving average is above the 26-d moving average and vice versa.
1. The MACD and the baseline
When the MACD rises above the baseline (zero), it’s considered a bullish signal. Furthermore, when the positive value increases, it means the uptrend momentum is increasing. On the contrary, when the MACD drops below the baseline, it’s considered a bearish signal. When the negative value drops further, it means the downtrend momentum is strengthening.
2. The MACD and the signal line
When the MACD line crosses above the signal line, it’s considered a bullish signal. It indicates that the price may change direction to the upside. When the MACD line crosses below the signal line, it’s considered a bearish signal. It indicates that the price may change direction to the downside.
As the histogram represents the difference between the MACD and the signal line, the implications are similar. When the bar turns from red to green, there may be a bullish reversal. When the bar turns from green to red, a bearish reversal may be on the way.

3. The MACD and the asset price
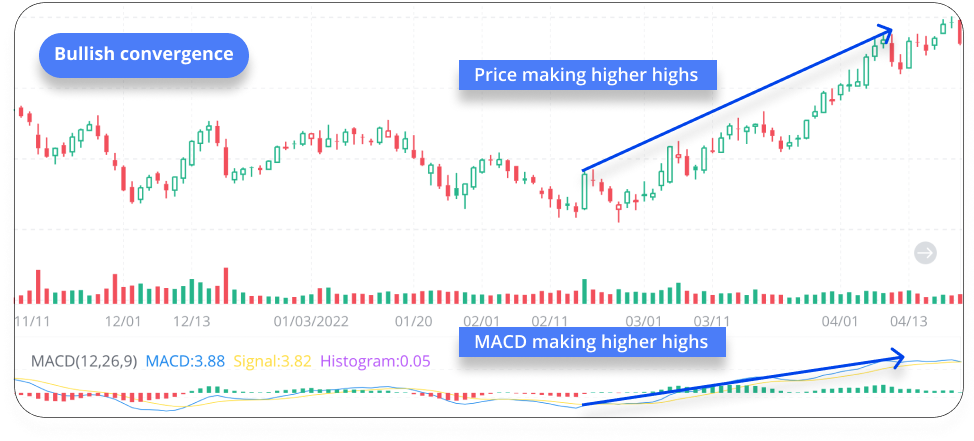
When the MACD goes in the same direction with the asset price, it’s called a convergence. It confirms the current price trend.
Bullish convergence
When the asset price and MACD are both making higher highs, a bullish convergence is formed. It double confirms the uptrend.
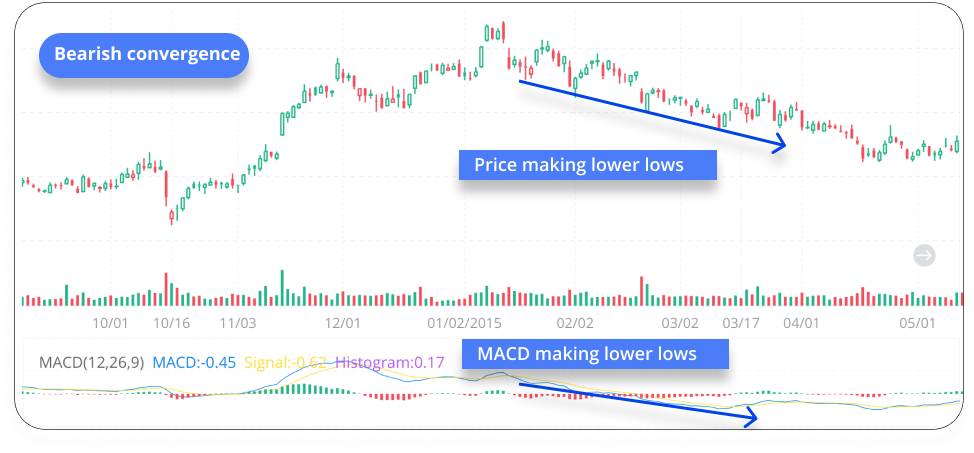
Bearish convergence
When the asset price and MACD are both making lower lows, a bearish convergence is formed. It double confirms the downtrend.
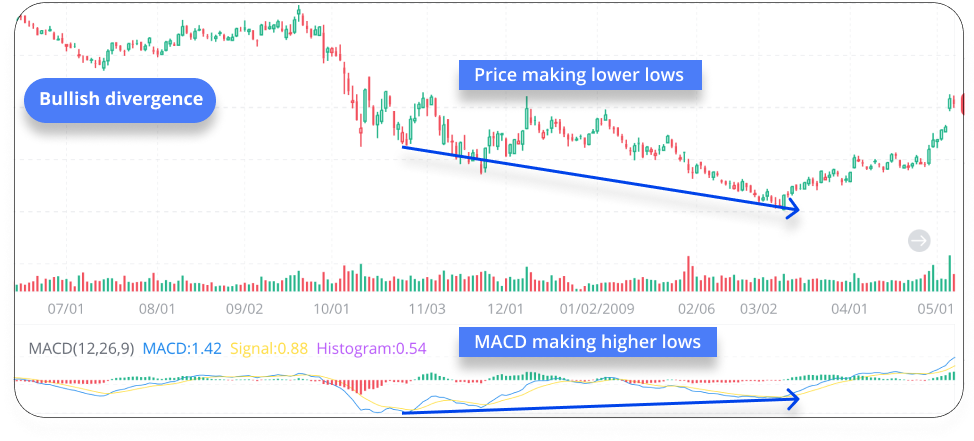
However, when the MACD line diverges with the asset price trend, it may imply a weakening trend or a potential reversal.
Bullish divergence
When the MACD makes higher lows while the asset price is making lower lows, a bullish divergence is formed. It indicates that the despite the price is still falling, the downside momentum is weakened. A reversal might be on the way. However, we should note that as long as the MACD is in the negative zone, the downside momentum is still stronger than the upside momentum.
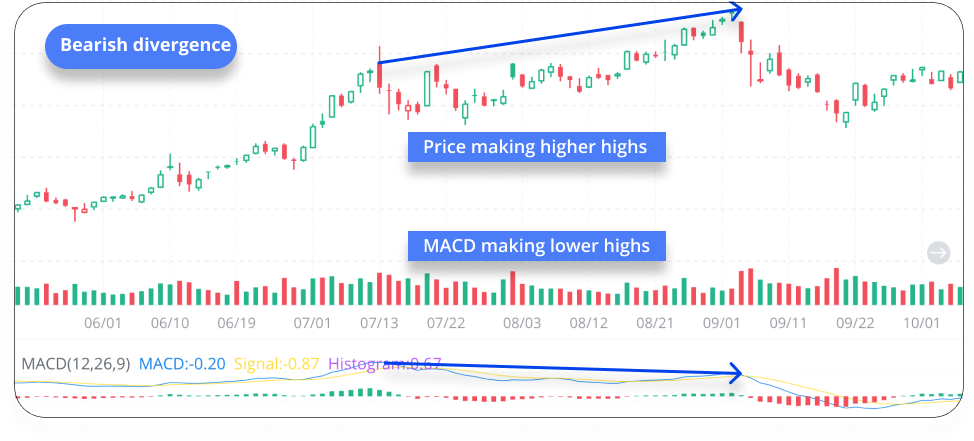
Bearish divergence
When the MACD makes lower highs while the asset price is making higher highs, a bearish divergence is formed. It indicates the upside momentum is weakened. Investors might need to look out for a downtrend.
Get a Heads-Up When Technical Signals Appear
Watching prices can be time-consuming. One simple way to watch a price efficiently is by setting a customized price alert. Check below to see how.

*Finally, please note that technical analysis is not 100% accurate. The interpretation of results is generally subjective.
What's More
-Try it out on paper trading on our latest mobile version
-Take a quiz to evaluate yourself on our latest mobile version

