Footprint Chart Tutorial: A Starter Guide for Traders

What is a Footprint Chart?
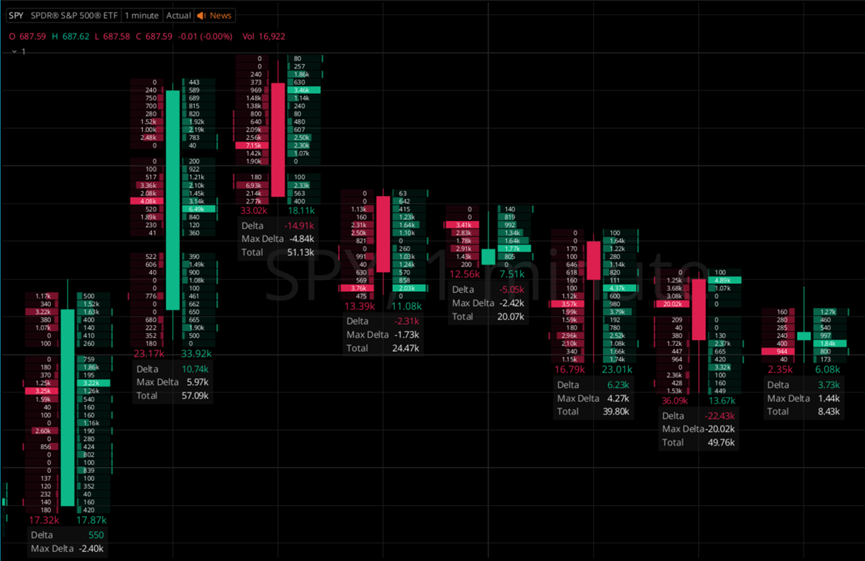
A Footprint Chart is an advanced type of candlestick chart. Instead of only showing the open, high, low, and close, it reveals the trading activity inside each candle. It displays the volume at every price level, showing how buyers and sellers interact in real time.
Key Elements to Understand
A standard Footprint bar breaks down a single period of trading:
- Price Levels (Y-axis): Each horizontal row represents a specific price.
- Volume at Price: Numbers on each row show the total contracts or shares traded at that price.
- Bid vs. Ask (Buying vs. Selling): Numbers are split, for example, '70 | 30'.
- Left Number (e.g., 70): Volume transacted at the BID price. This represents AGGRESSIVE SELLERS hitting the bid. It is often colored red.
- Right Number (e.g., 30): Volume transacted at the ASK price. This represents AGGRESSIVE BUYERS lifting the ask. It is often colored green.
- Delta: The difference between the Ask volume and the Bid volume (e.g., 30 - 70 = -40). A positive Delta suggests net buying pressure, while a negative Delta suggests net selling pressure.
- POC (Point of Control): The price level within the bar that had the highest total volume. This is the price where the market found the most agreement.
How to Use it
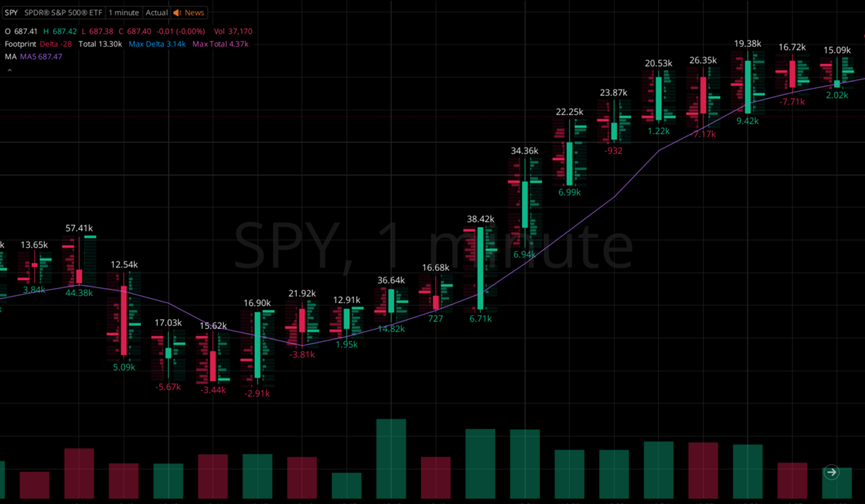
Scenario 1: Identifying a Strong Move
Look for a bar where the volume is heavily concentrated on the right side (the Ask). This can confirm the strength behind the move.
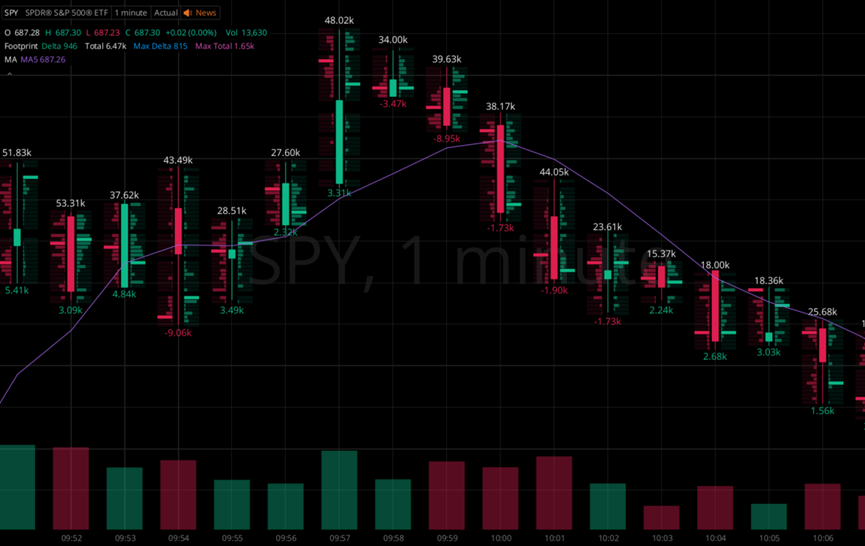
Scenario 2: Spotting Weakness at a High
If the price makes a new high but the Footprint shows large selling volume appearing, it can be a warning sign. This is especially true if the next bar fails to continue higher and has a negative Delta. It suggests the rally is exhausting and sellers are stepping in.
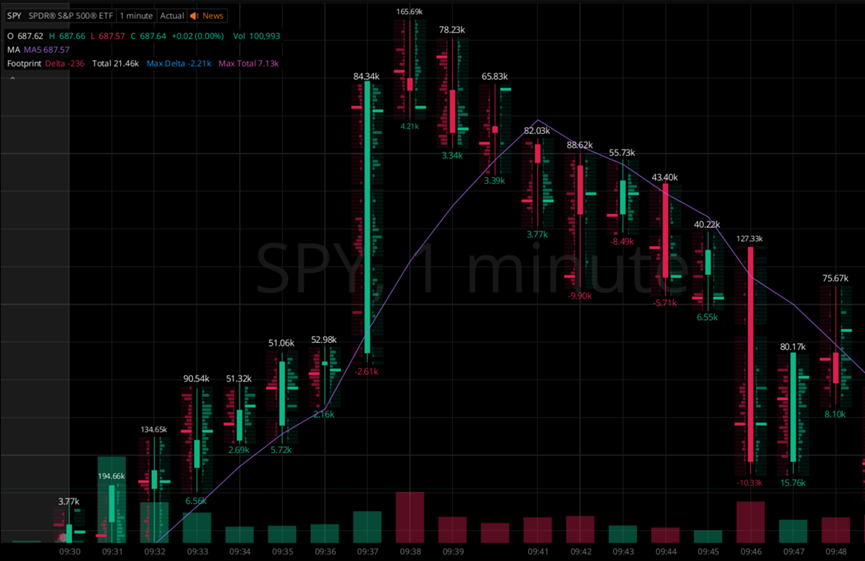
Scenario 3: The "Ignored" Level
Notice when price moves very quickly through a price level with extremely low volume. This can indicate a lack of trading interest or liquidity at that price. Some traders look to these levels as a sign that price may return for a proper test.
Things to take note of
- Avoid excessive reliance on a single signal.
- Verify together with other technical indicators.
- Pay attention to the performance differences in different market environments.
