Understanding the Yield Curve

What is the Yield Curve?
When analysts refer to “the yield curve”, they are typically referring to the annualized returns US Treasury bonds are currently paying for maturity dates ranging from 1 month to 30 years. This is most often represented by a graph similar to the one below:
While the US Treasury curve is the most cited, yield curves can be constructed for any category of bonds, such as BBB rated corporate bonds or NY state municipal bonds. A yield curve allows investors to compare bonds of similar credit quality with varying maturities, providing insights into risk and potential reward. Yield curves reflect market expectations about future economic conditions, making them a valuable tool for understanding market sentiment.
Why is the US Treasury Yield Curve Important
In this article, we’ll focus on the U.S. Treasury yield curve, which investors commonly use as a benchmark for the risk-free rate of return. This curve serves as a foundation for comparing bonds, helping investors evaluate whether a bond offers sufficient return relative to its risk.
For example, if the five-year Treasury bond yields 3%, and a five-year corporate bond offers 4%, the corporate bond has a 100-basis point, or 1%, “spread over Treasury.” This comparison helps investors make informed decisions about risk and reward.
Beyond bond comparisons, the yield curve offers insights into broader economic conditions, such as financial stability, growth prospects, inflation expectations, and overall market sentiment. As the curve shifts, it influences investment decisions across asset classes, including equities, real estate, and commodities, as changes in interest rates affect corporate borrowing costs, mortgage rates, and currency valuations. By analyzing the yield curve, investors can align their portfolios with anticipated economic trends and forecasts.
See More About How Bonds Work
Interpreting the Yield Curve
The yield curve’s shape is not static; it evolves with market conditions, offering clues about future economic trends. Here are three common yield curve shapes:
Normal Yield Curve: This upward-sloping curve is the most common, with short-term bonds yielding less than long-term bonds of the same credit quality. Investors expect higher returns for longer maturities due to increased risk. The steepness of the curve provides further insight into expectations for future interest and inflation rates.

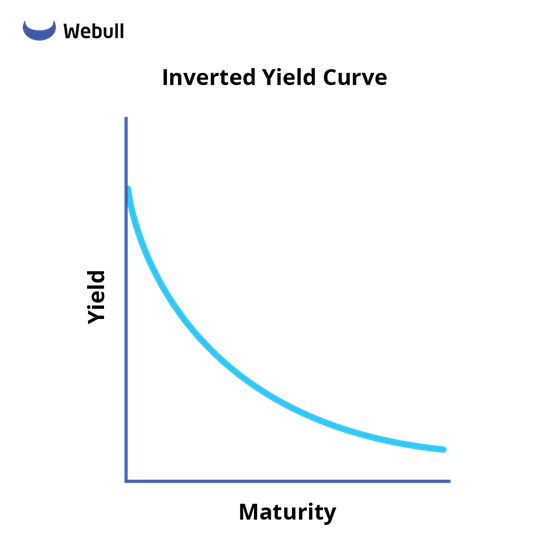
Inverted Yield Curve: An inverted yield curve, where long-term yields are lower than short-term yields, signals potential economic downturns. Investors accept lower long-term yields when they expect short-term rates to fall, typically indicating a looming recession. Historically, an inverted curve has often preceded recessions within 12-24 months.
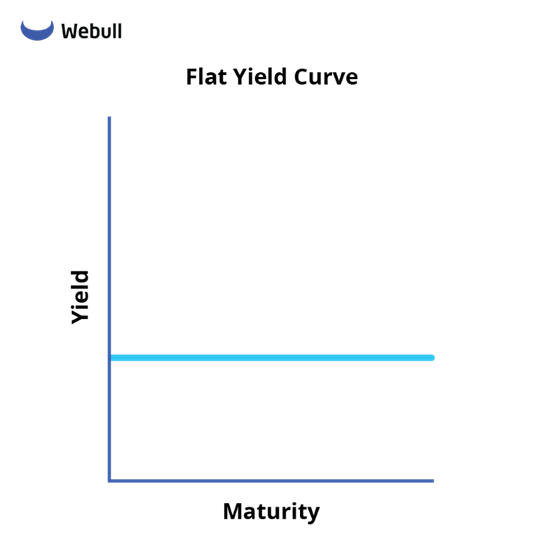
Flat Yield Curve: A flat yield curve occurs when there is little difference between short- and long-term yields. This shape often reflects economic uncertainty or a transition phase. While a perfectly flat curve is rare, the flattening of the curve can signal a shift in market sentiment.
Sometimes, the yield curve can be a mix of normal and inverted segments. Analysts typically define a curve as inverted when the 10-year rate is lower than the 2-year rate. Mixed curves require deeper analysis to understand their implications fully.
Read More: How Bond Prices, Rates, and Yields are Related
Using the Yield Curve
The yield curve is a dynamic, supply-and-demand-driven tool that incorporates all publicly available information. Understanding its shape and implications allows investors to make informed decisions that align with their financial goals and current market conditions. Here are 3 ways to use the yield curve when making investment decisions:
1. Building Bond Ladders
A Bond Ladder is a common bond investing strategy that invests in bonds across a range of maturity dates. For example, a 1-5 year bond ladder would typically consist of evenly spacing bond maturities across 1, 2, 3, 4, and 5 years. Each maturity year is considered a “rung” on the bond ladder.
Read More About Building Bond Ladders
2. Identifying the “Sweet Spot”
Use the yield curve to target specific maturities. If the curve steepens between 3 and 5 years, a 5-year bond might offer significantly higher returns, making it more attractive. Conversely, if the curve is flat between 5 and 10 years, a shorter-term bond may be preferable.
3. Evaluating Other Investments
Treasury yields represent the “risk-free” rate, providing a benchmark for comparing other investments. Whether evaluating corporate bonds or other asset classes, the yield curve offers a baseline to assess relative risk and potential return.
The Bottom Line
Understanding the yield curve is helpful in making informed investment decisions. It not only provides a snapshot of bond yields across various maturities but also offers insights into market expectations for economic conditions. Whether it’s shaping your bond strategy, guiding asset allocation, or comparing investment opportunities, the yield curve is a tool for optimizing your portfolio in the financial world.
Make sure to head to Webull Learn to read more about Bonds, Stocks, ETFs, and Options to help enhance your investing strategy and learn more about our products.
