Trend Analysis

Three directions of trends
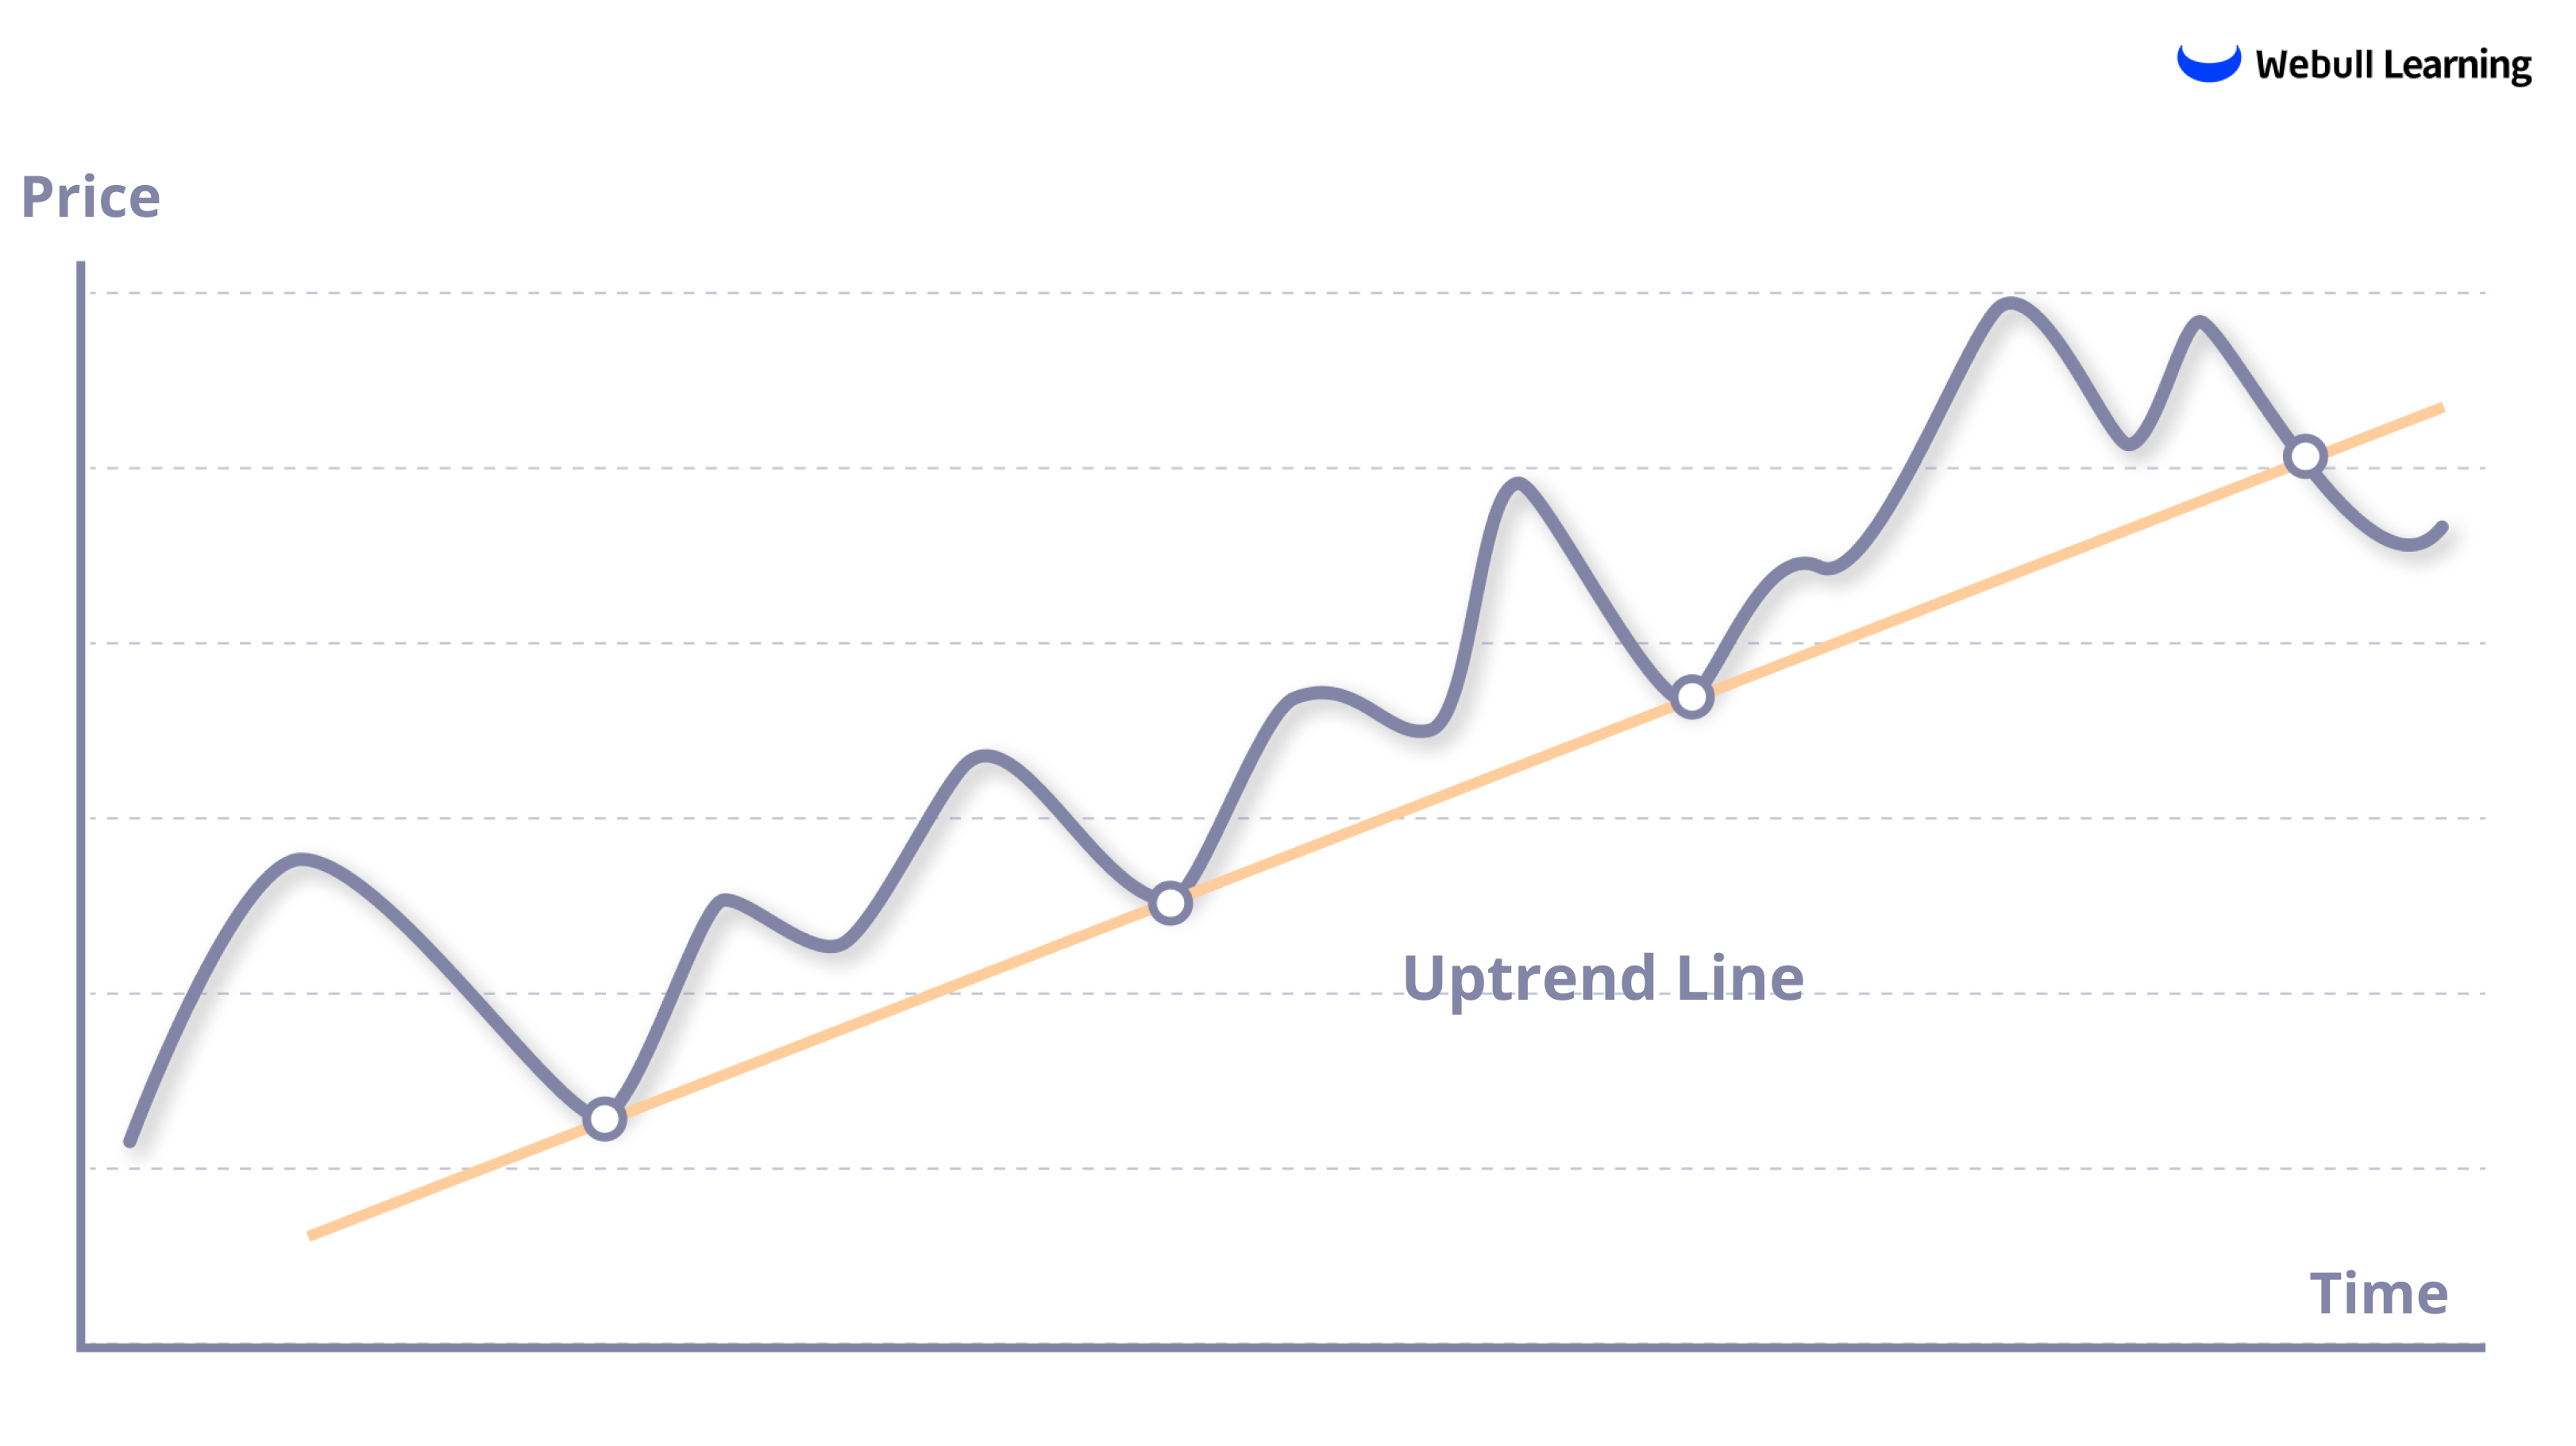
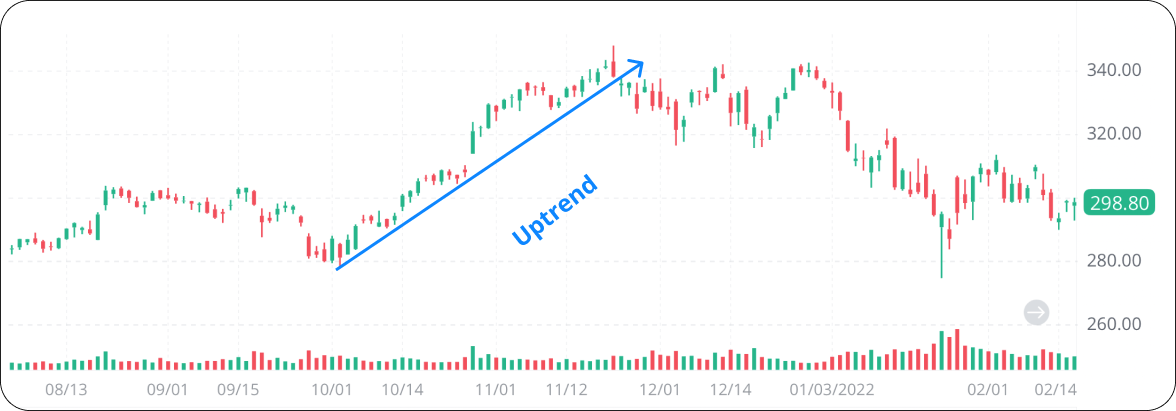
1. Uptrend
An asset is in an uptrend when price moves up to higher highs and higher lows. This occurs when demand exceeds supply. Buyers are willing to pay higher prices for the asset over time.
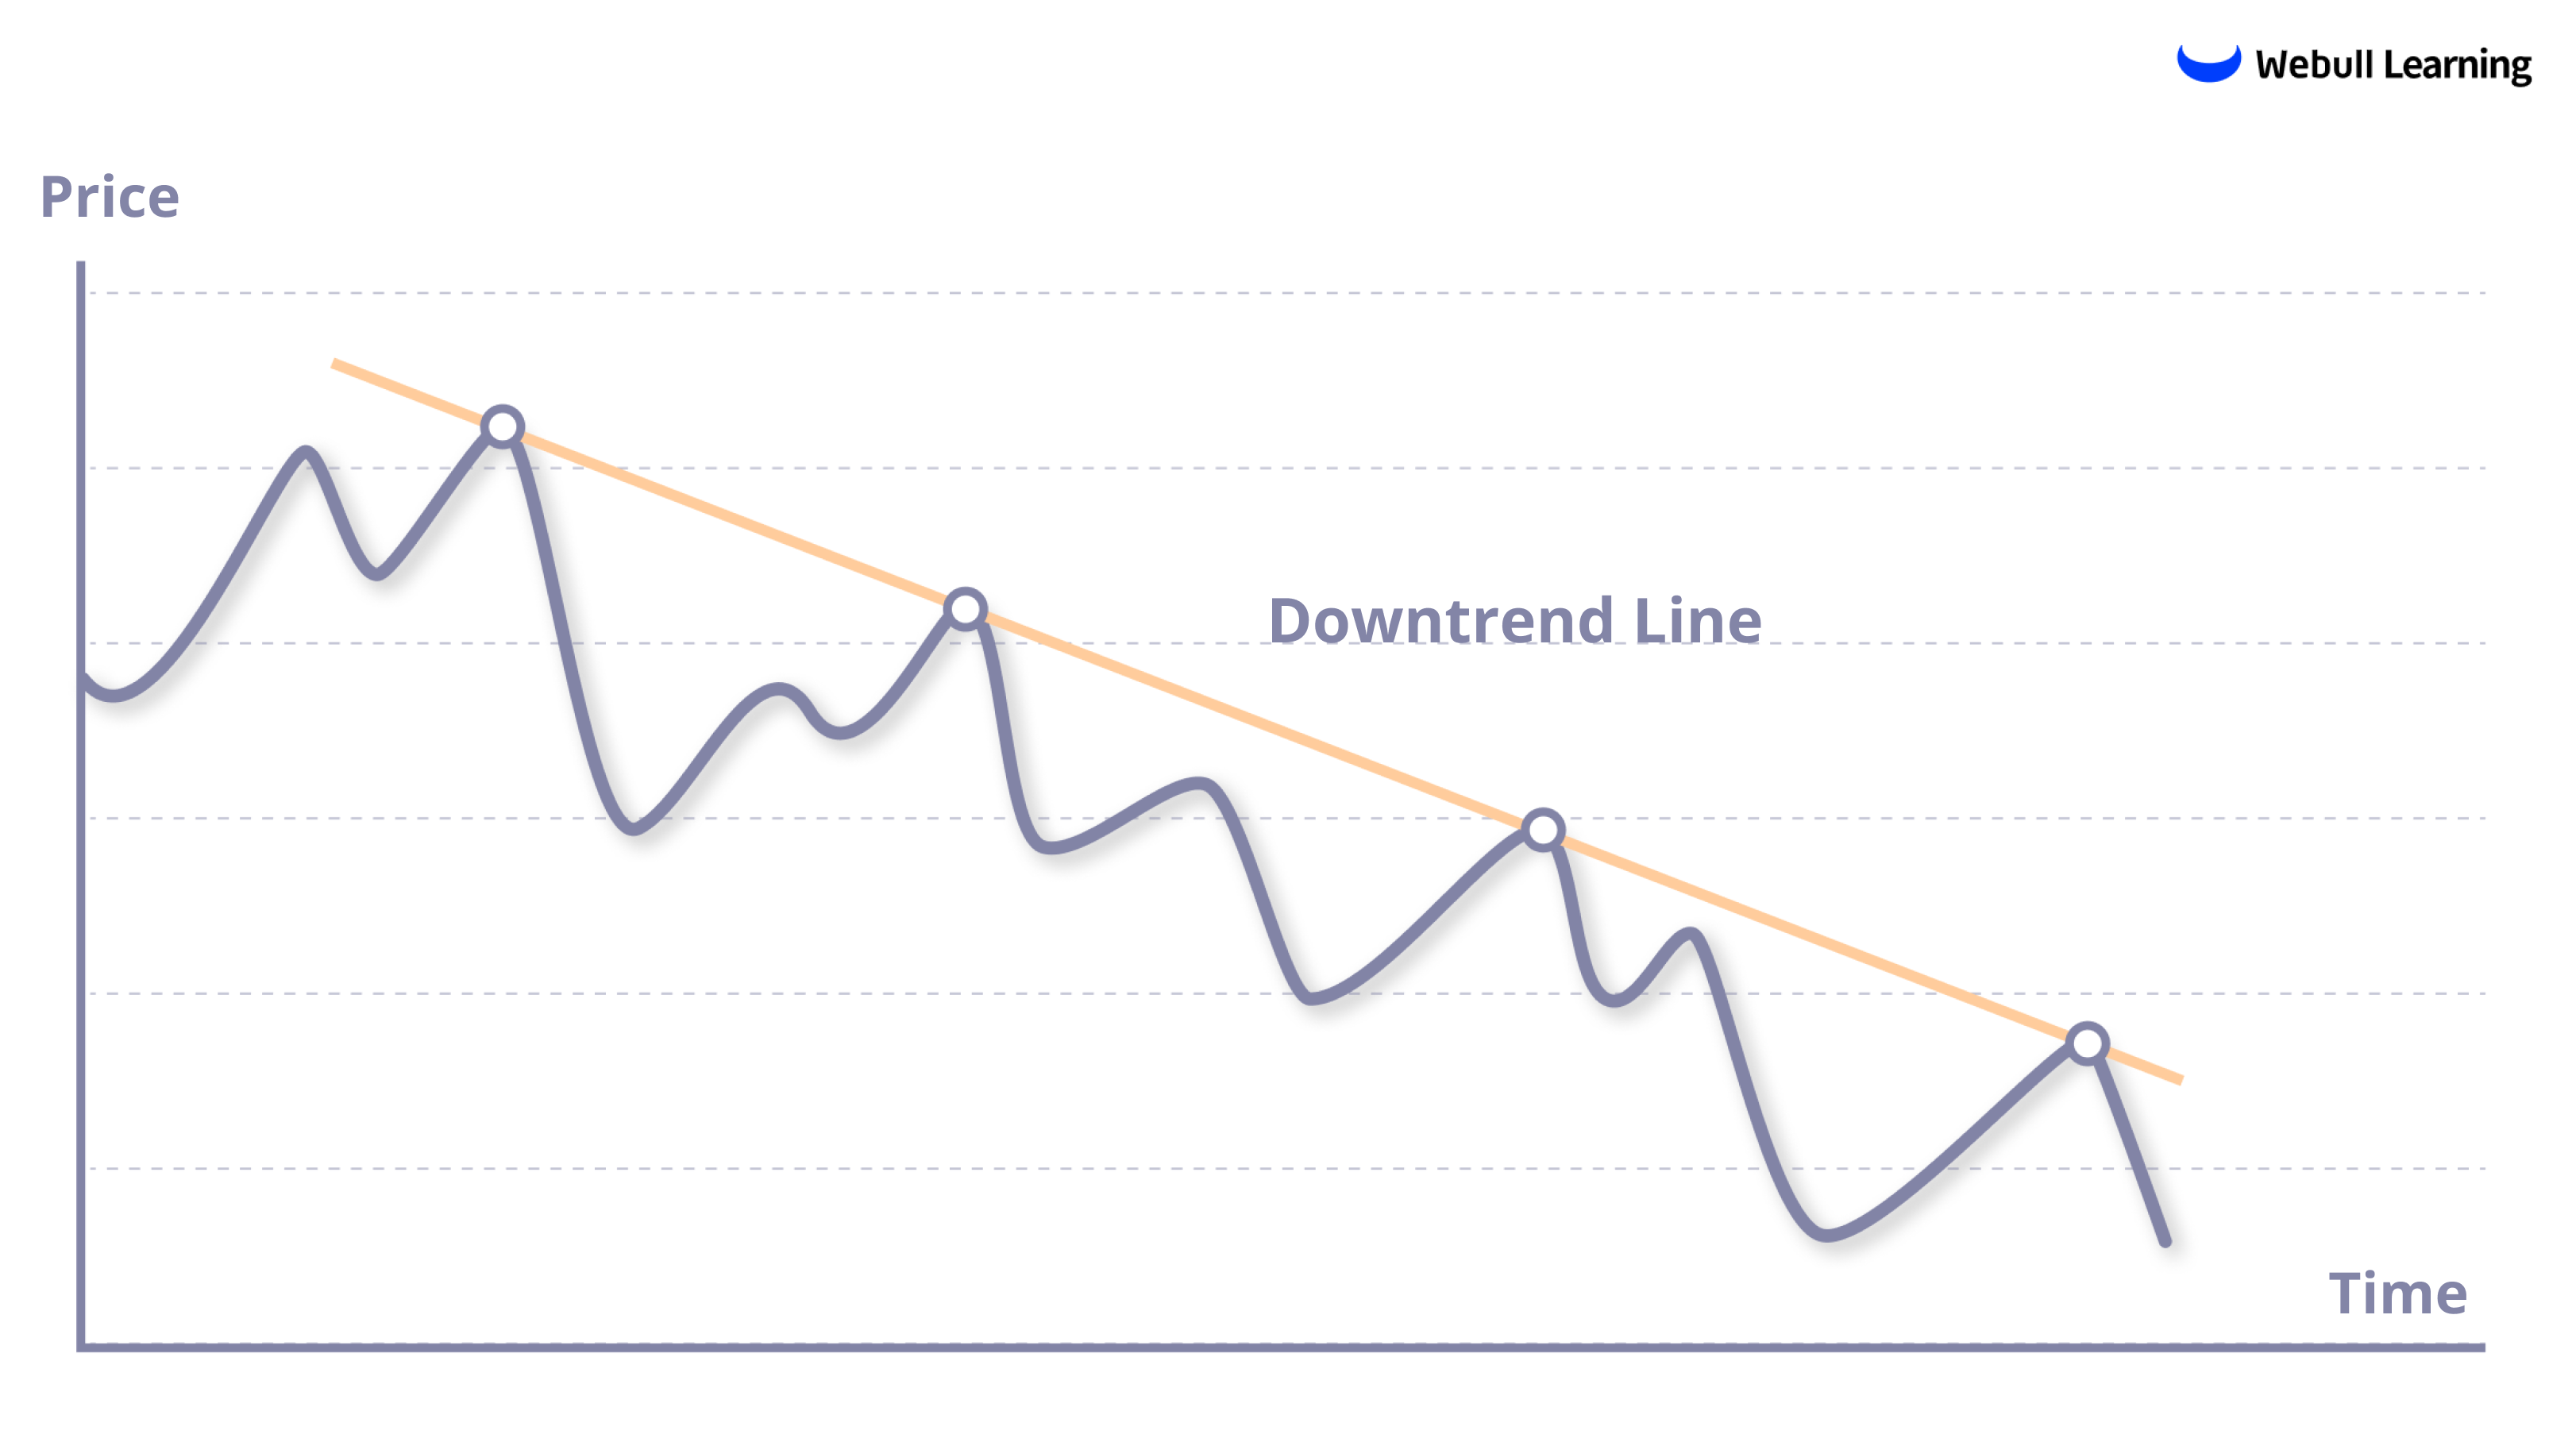
2. Downtrend
An asset is in a downtrend when price drops to lower highs and lower lows. This occurs when supply exceeds demand. Sellers are accepting lower prices to exit long positions over time.
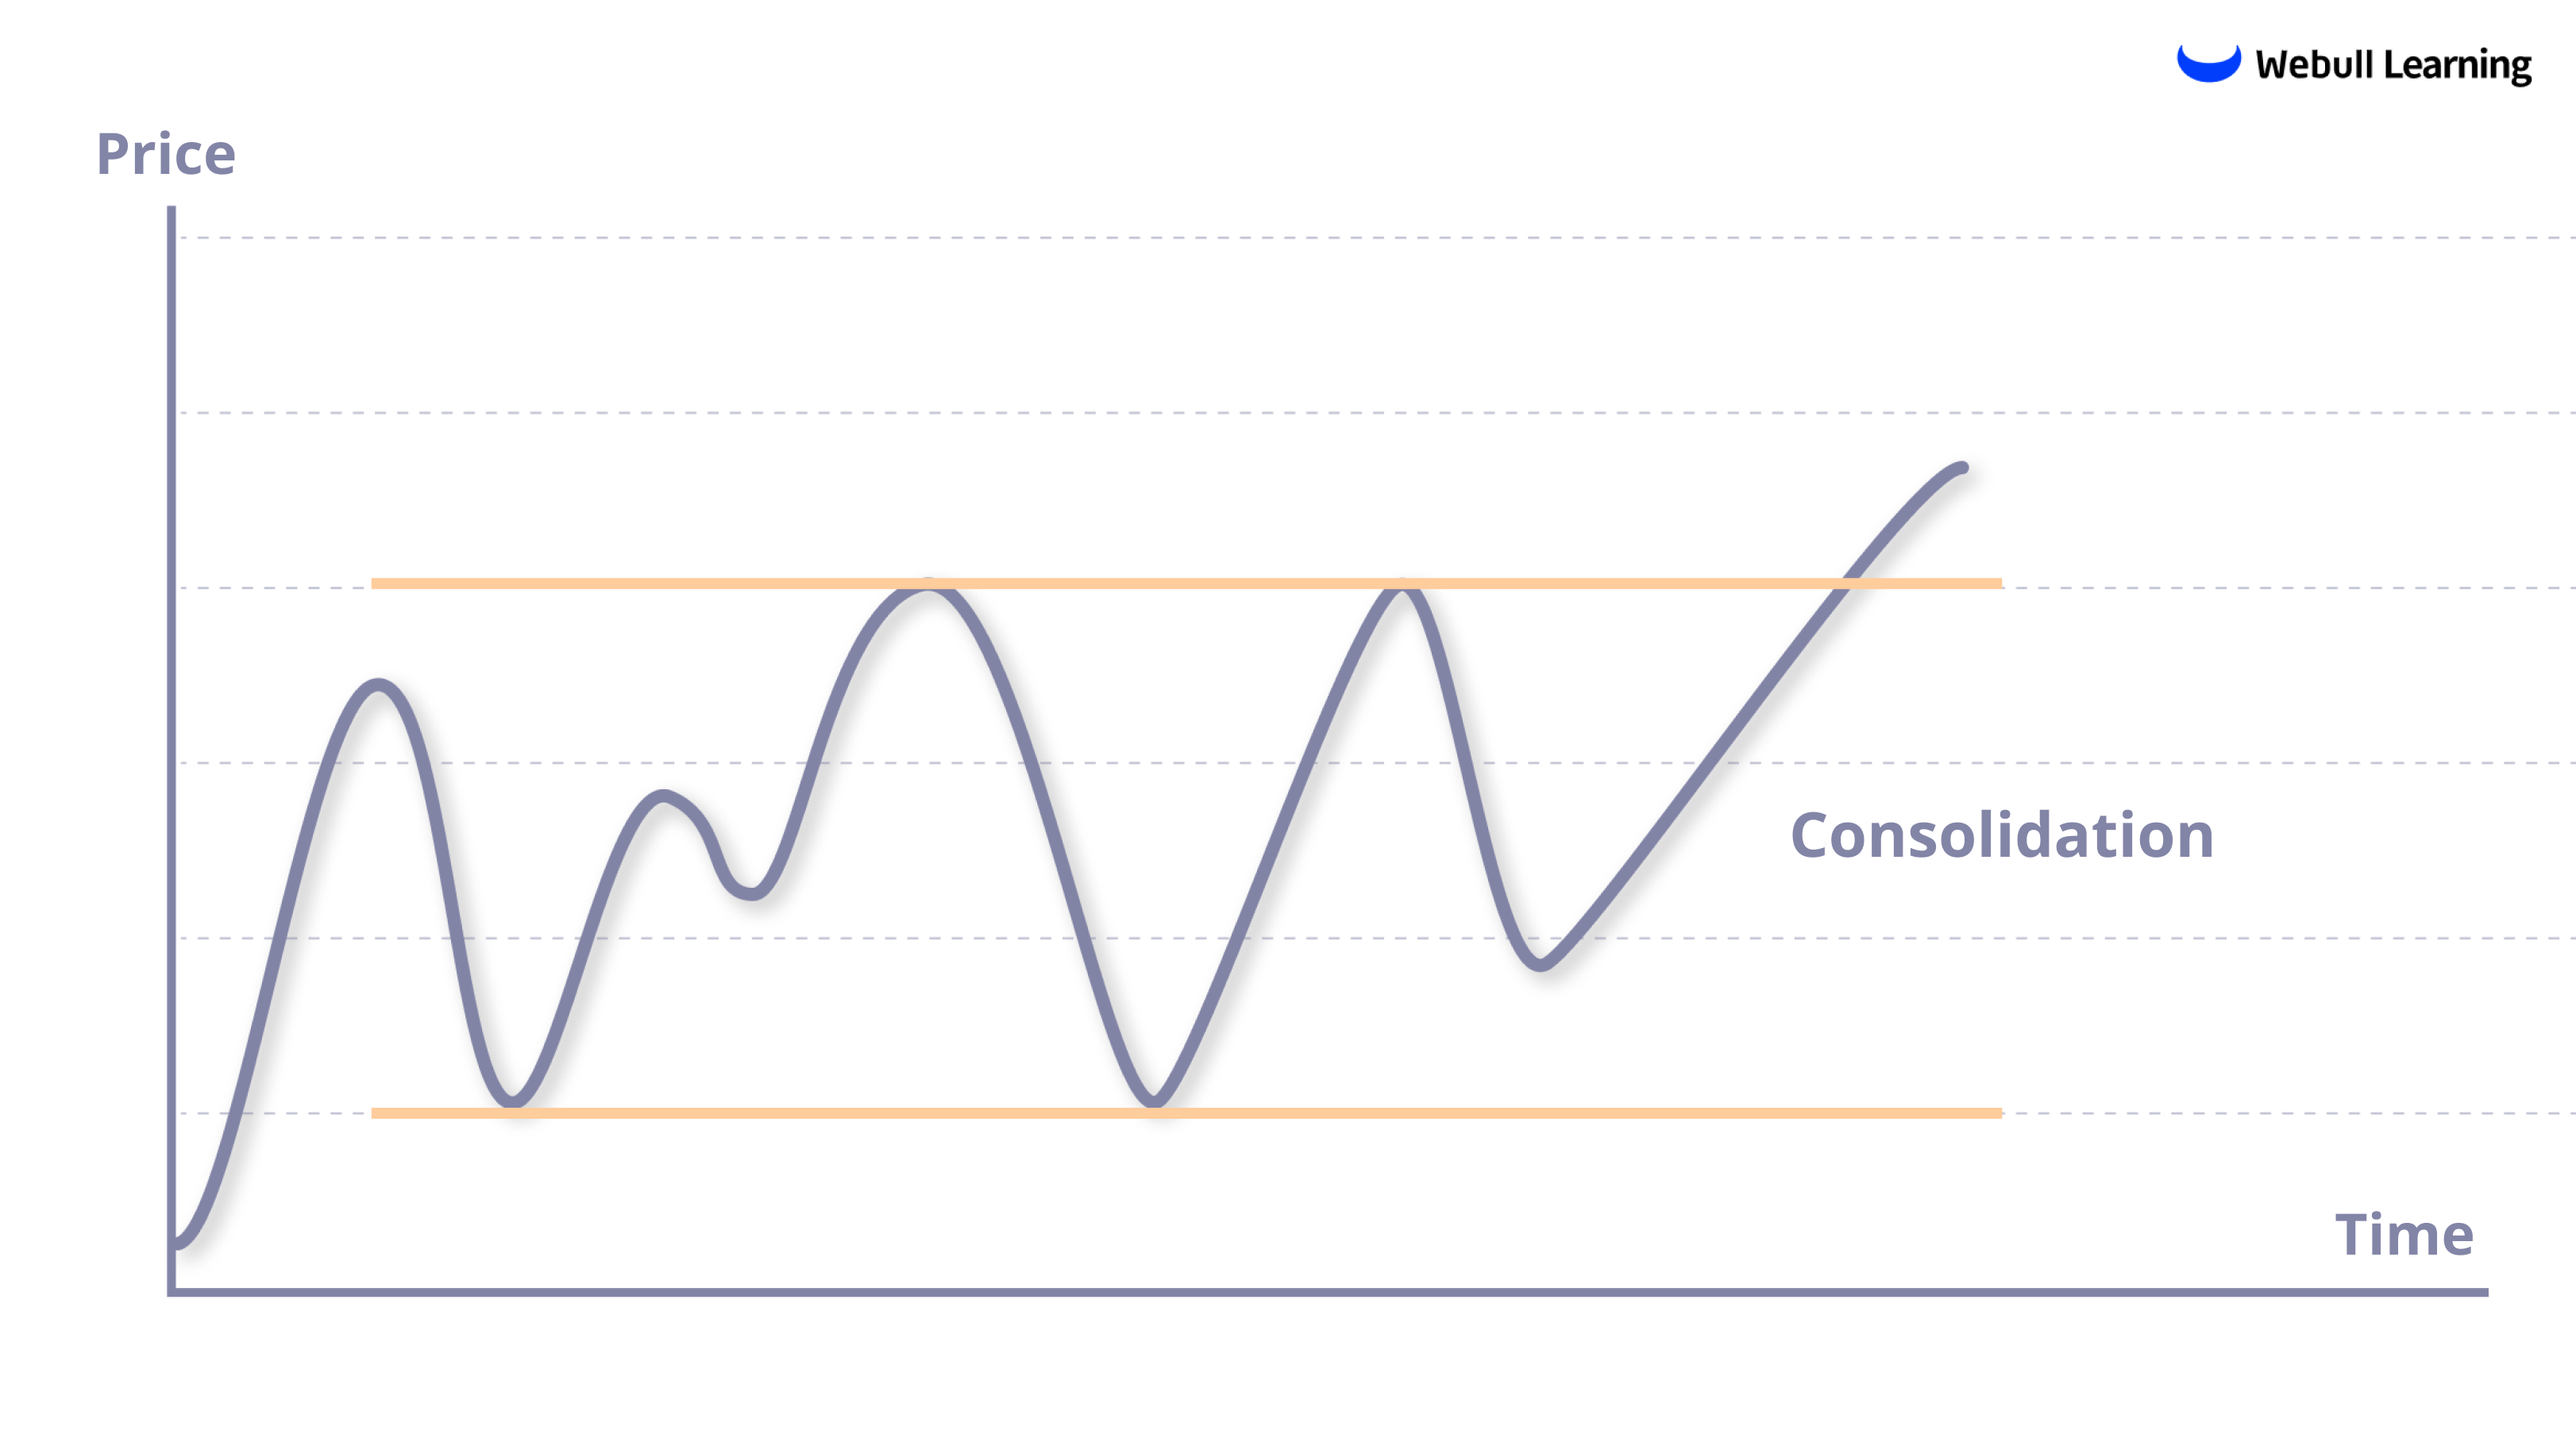
3. Consolidation
When an asset is not trending, it is considered to be in a consolidation. This is when its prices move sideways.
Applying trend analysis
Uptrend lines are drawn by connecting two or more lows, while downtrend lines are drawn by connecting two or more highs on the price chart.
With Webull, you can draw your own trendlines on charts.
- The longer the prices remain above the trend line, the stronger the upward momentum is. If the price breaks below the uptrend line, it indicates that the uptrend is over and may signal a further decline in the price.
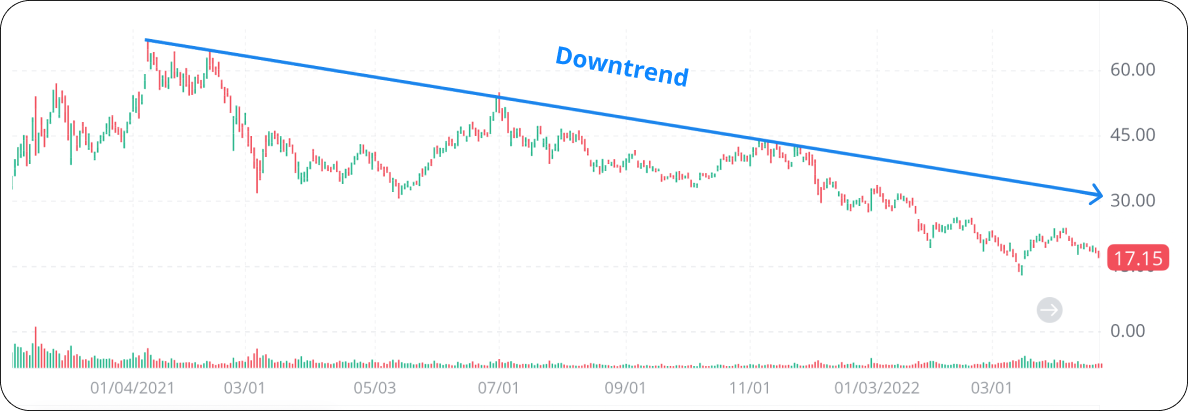
- The longer the prices remain below the trend line, the more significant the breakdown is. If the price rises above the uptrend line, it indicates that the downtrend is over and may signal a rise in the price.
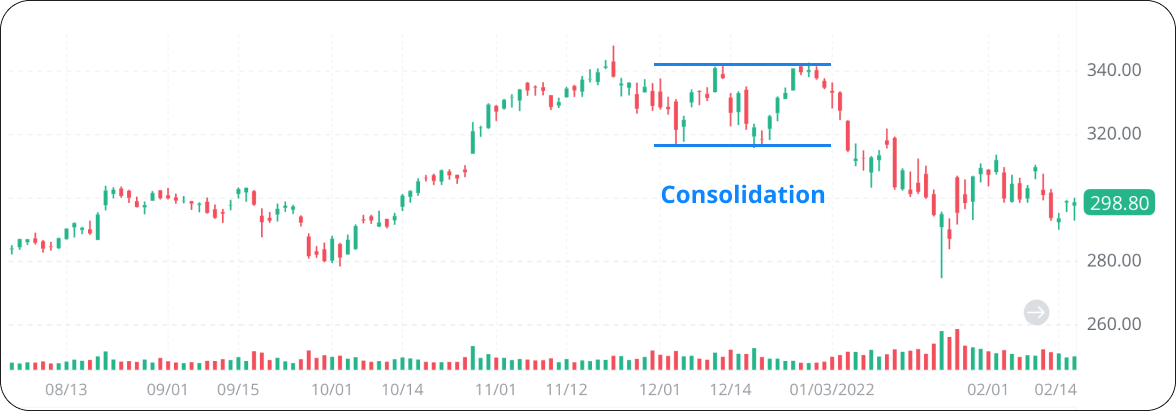
A consolidation follows each trend, and each consolidation establishes a trend. It’s important for investors to observe how the subsequent trend will develop.
*Finally, please note that technical analysis is not 100% accurate. The interpretation of results is generally subjective.
What's More
