
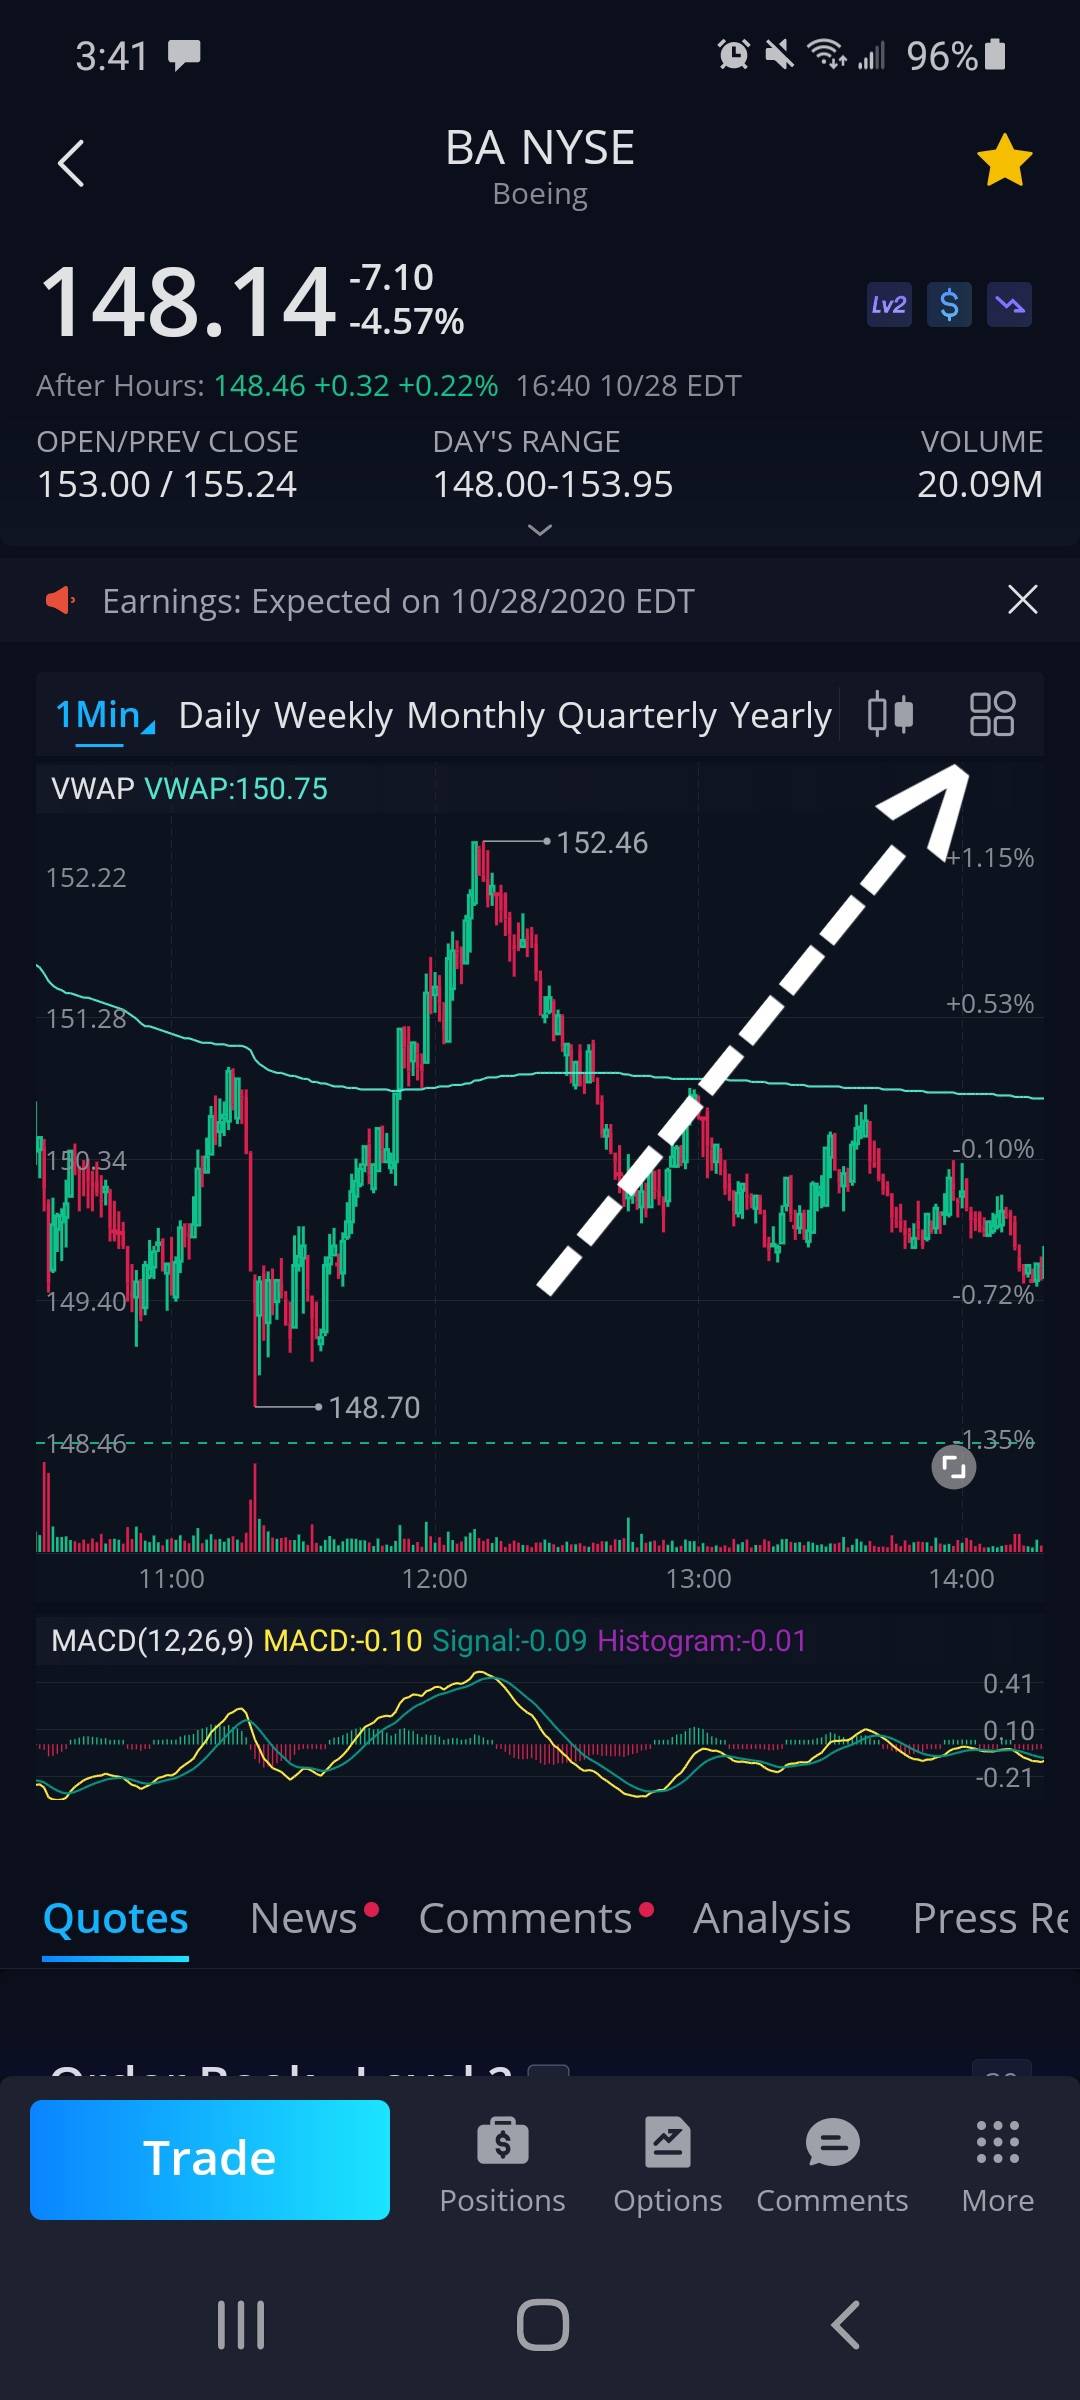
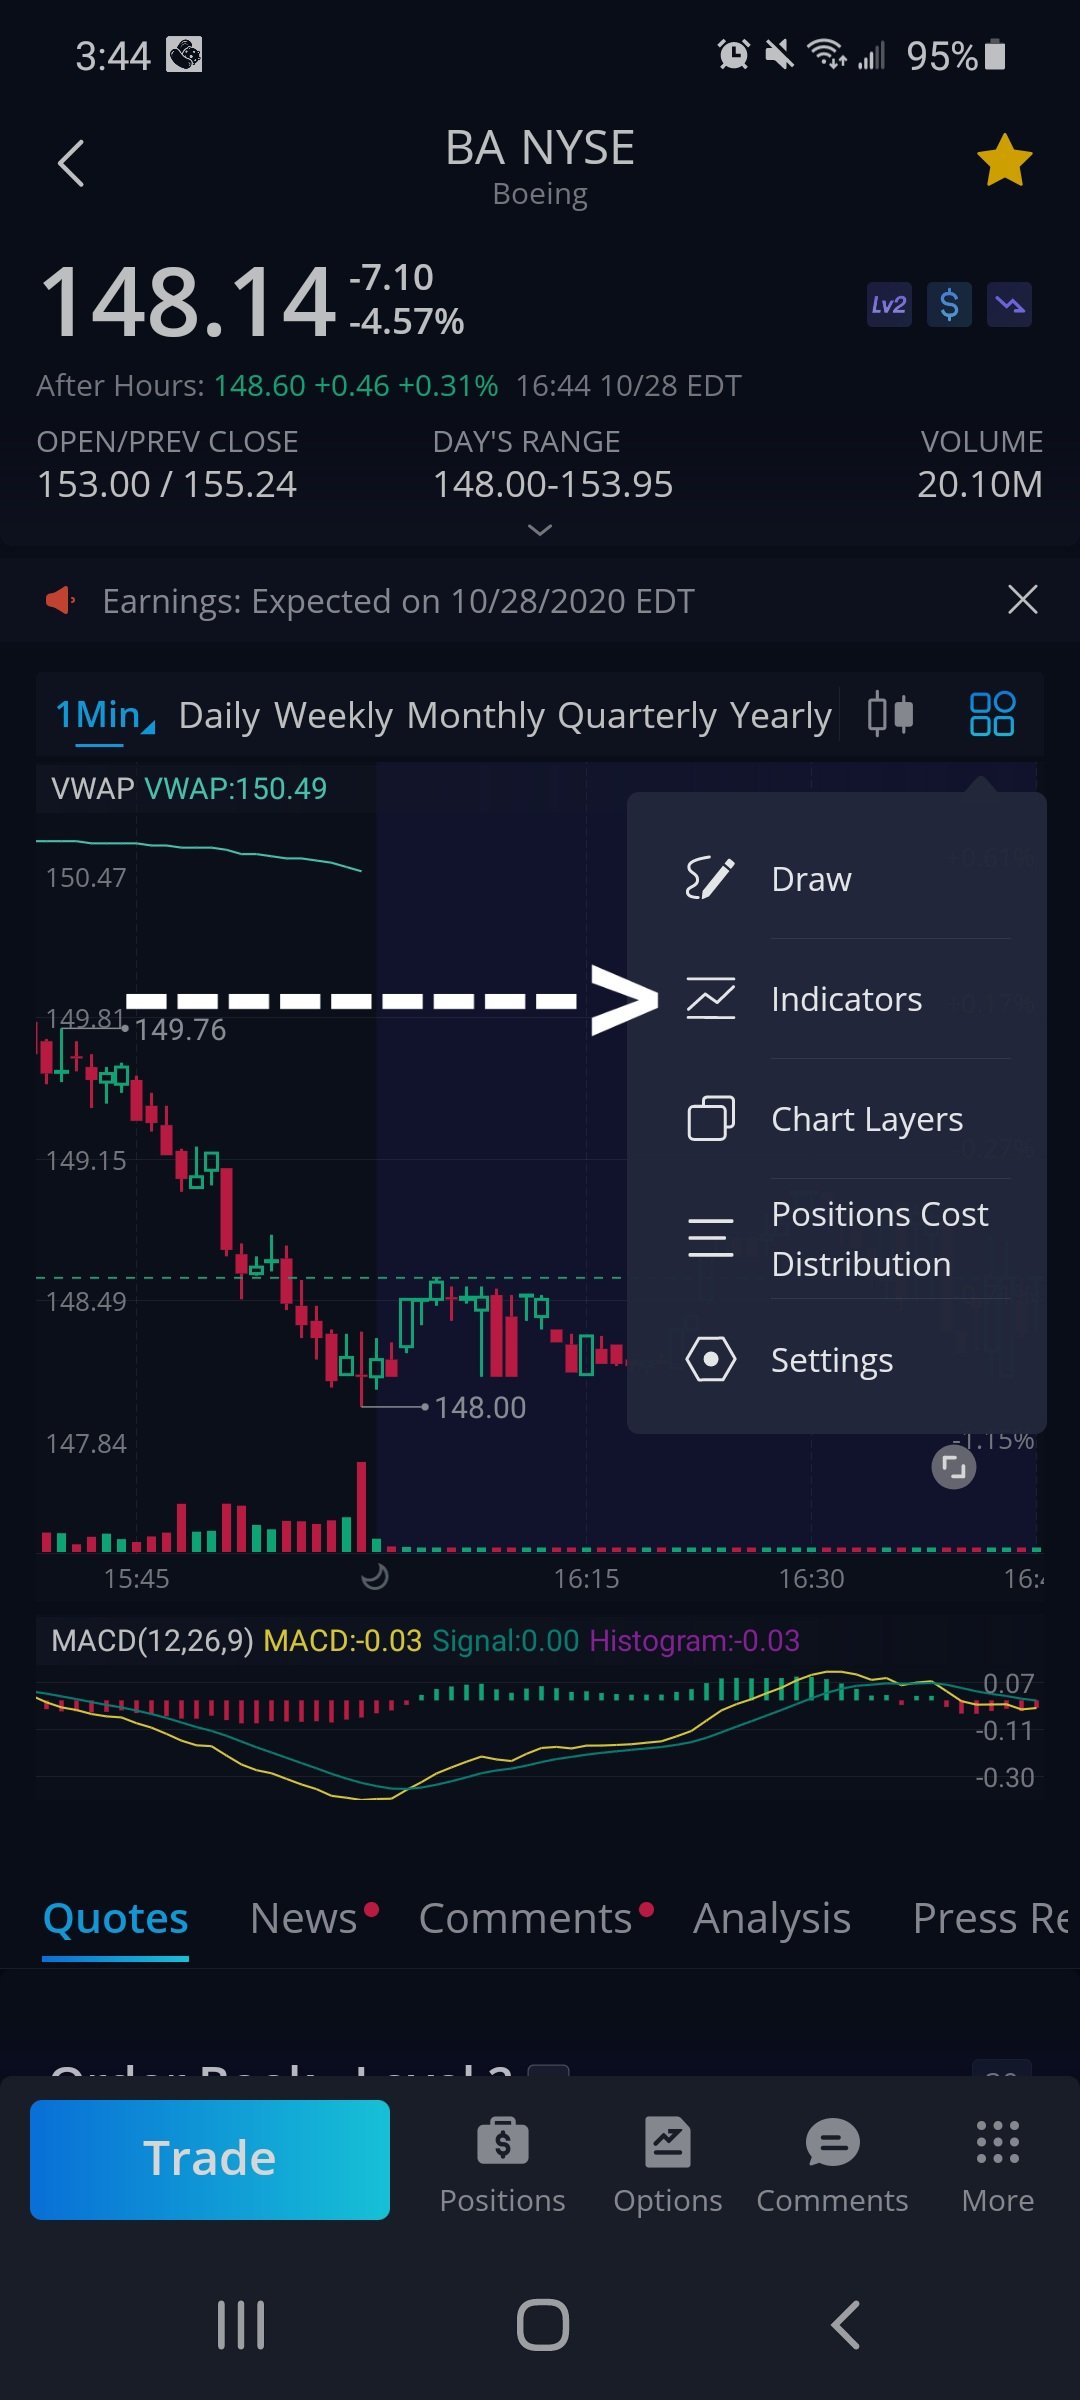
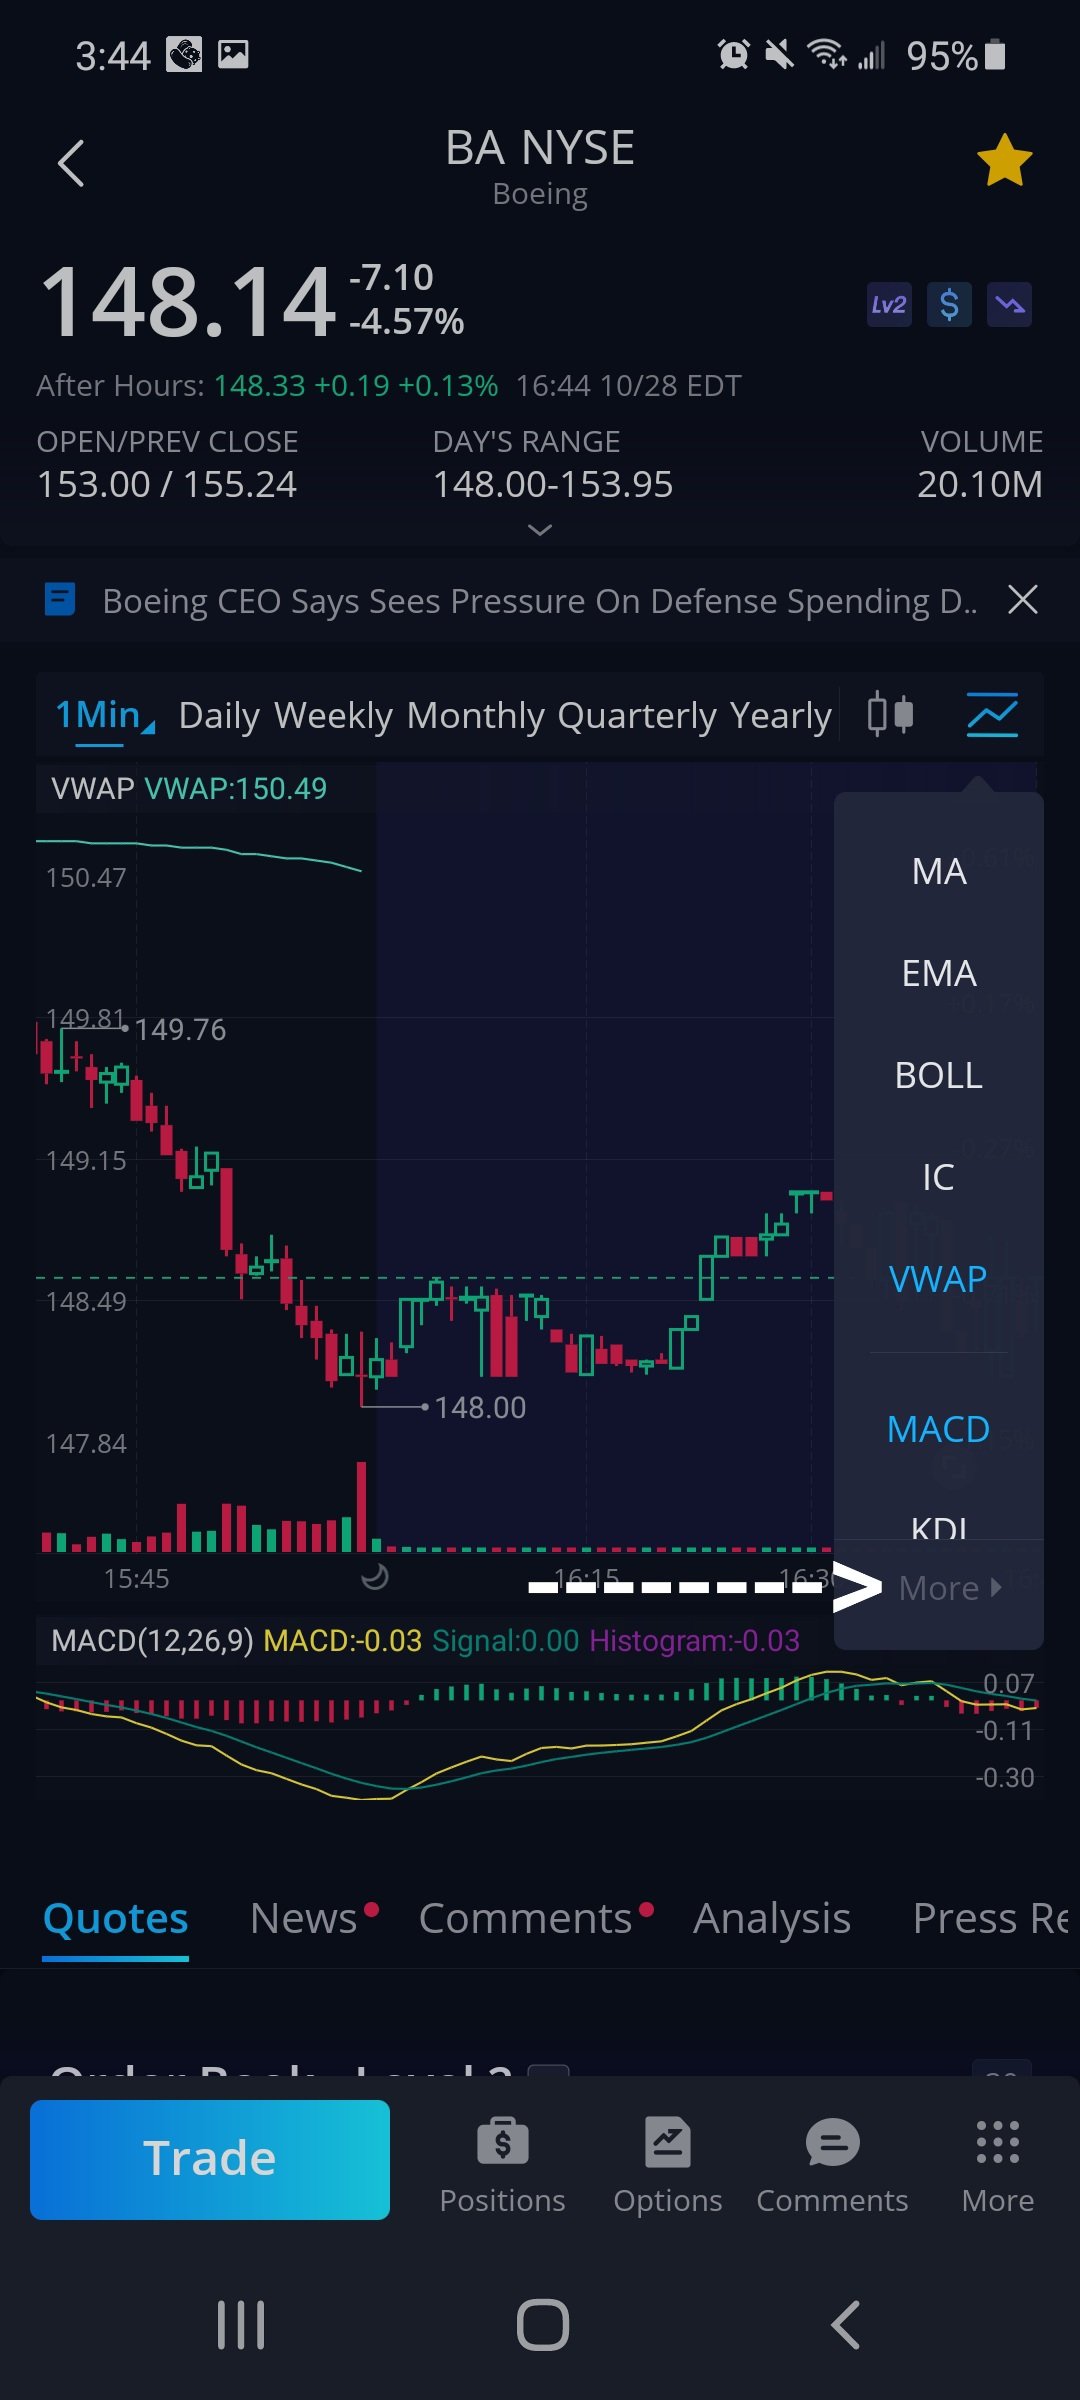
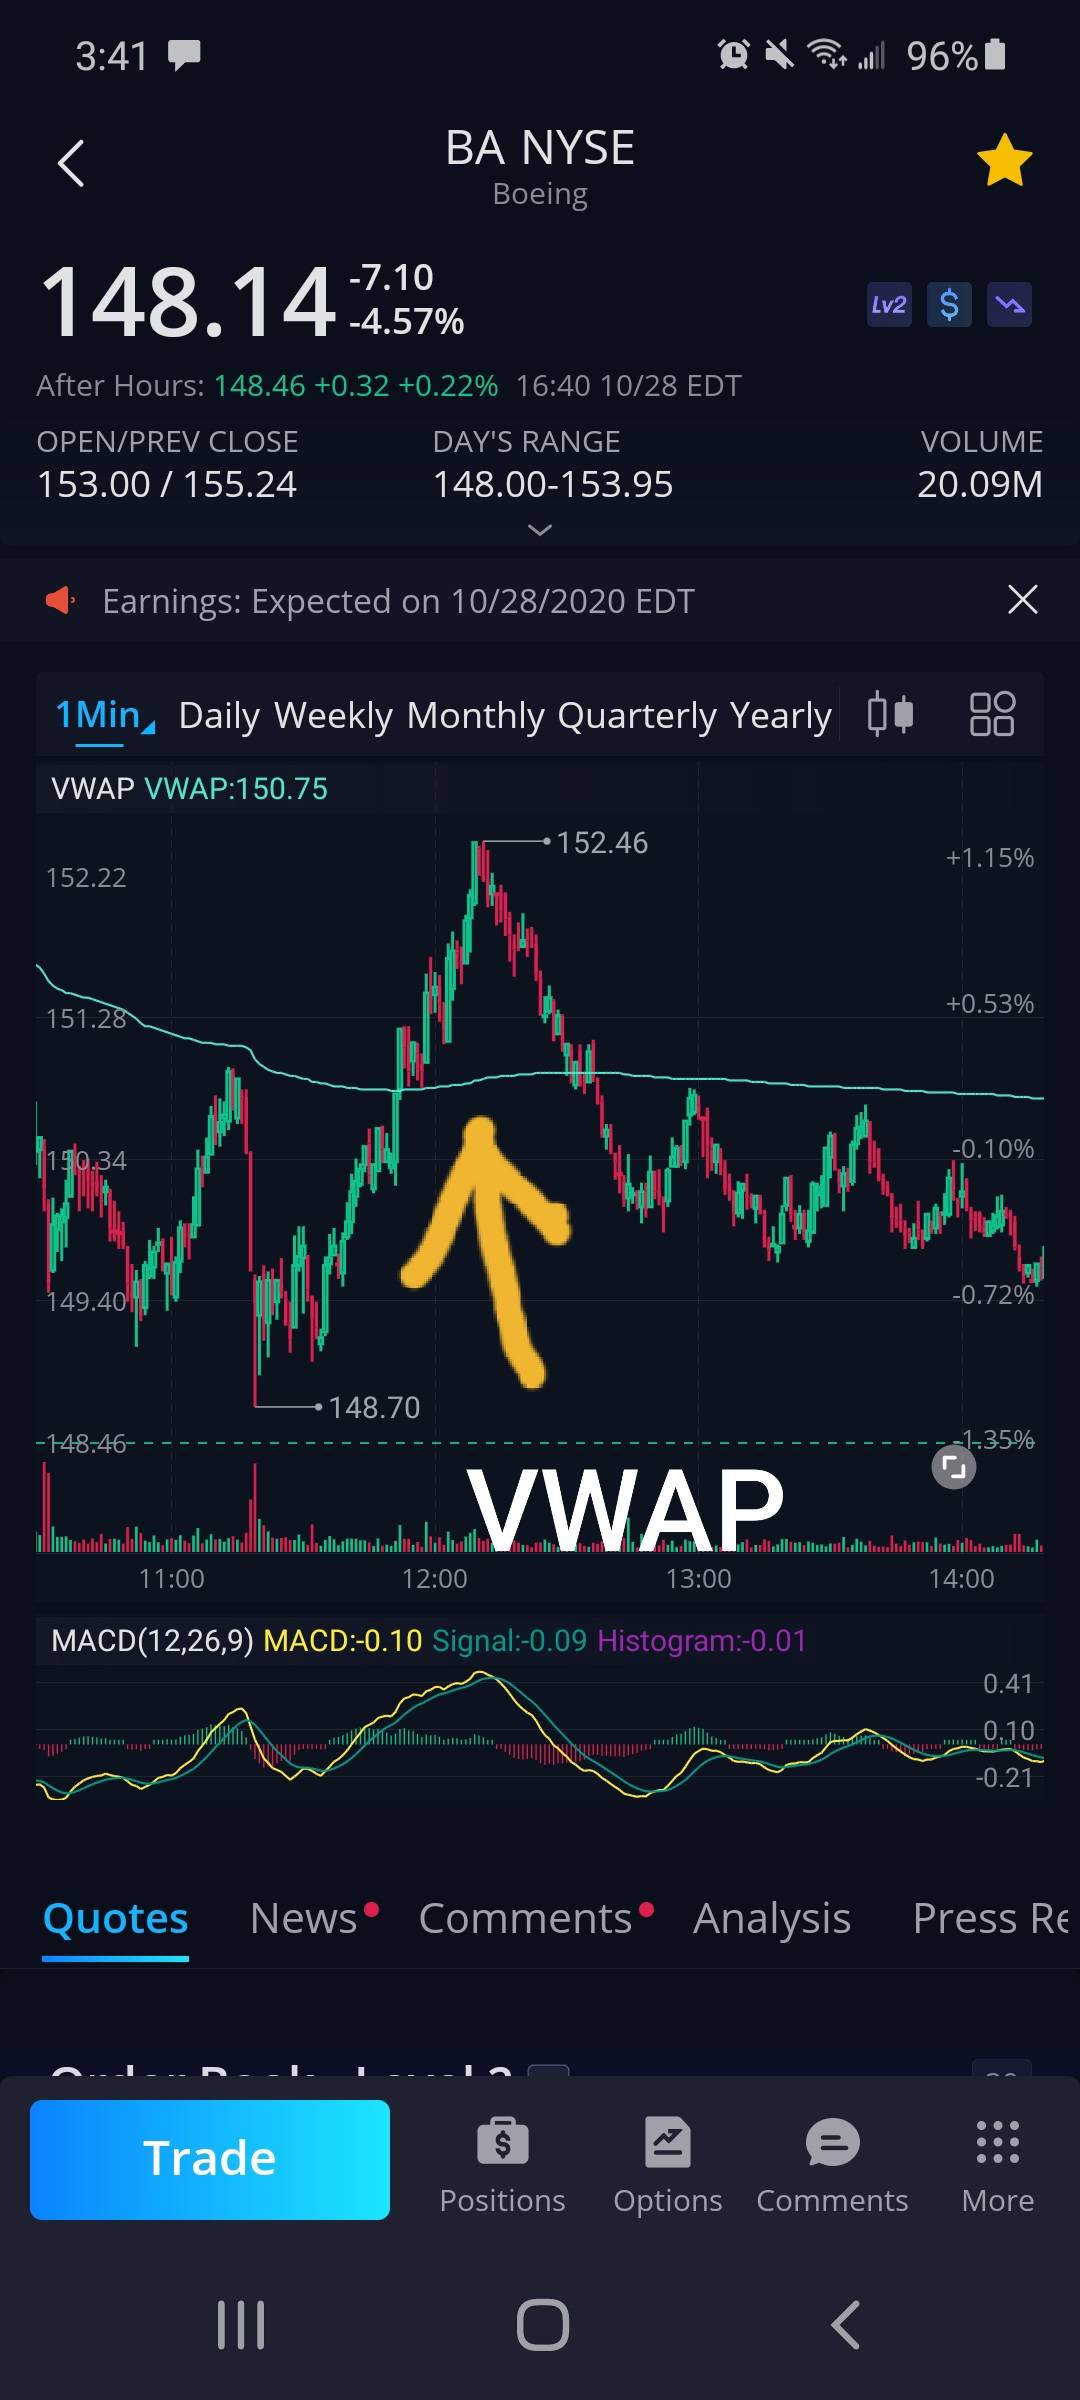
NEW INVESTOR ALERT 32: Today's term is "Indicator" and "VWAP". Extremely useful in reading a stock and helping you make a decision on wether its the right time to move on it or not. An "indicator" is a tool that you can use on any stock chart and uses different financial data of the stock to map out many different things. People use indicators to try and forecast "predict" the next move for a stock. The "VWAP" indicator is the volume weighted average price. This shows you the average price the stock has been trading at daily. So if a stock has been trading between $6.30 and $6.50 all day and then suddenly breaks below $6.10 I would consider the VWAP has been broken and the stock is morely likely to keep trending down rather than rise back up. You can find these indicators in any stock chart. The indicator option is at the top right of the chart as shown below and you can search VWAP and it will pull up for you along with many other useful indicators. Feel free to ask questions and or follow if you would like! $Tesla Inc $Apple Inc $Ideanomics Inc $XWELL Inc $Nikola Corp $Workhorse Group $Cenntro $Rocket Companies Inc $Boeing $Moderna

All Comments
No content on the Webull website shall be considered a recommendation or solicitation for the purchase or sale of securities, options or other investment products. All information and data on the website is for reference only and no historical data shall be considered as the basis for judging future trends.
- Copyright © 2026 Webull. All Rights Reserved